30 de June de 2021
Why linear encoder works for sports? Measure Fatigue and Autorregulation
When programming an effective training that is capable of producing optimal adaptations, many factors must be taken into account to ensure that the training is adequate for the athlete. Factors such as sleep time, stress, diet, motivation, fatigue or menstrual cycle can affect performance
The problem is that keeping track of all these factors can lead to confusion and misinterpretation of all the data. In fact, it could be much more interesting to track other variables that give us much more precise data with a linear encoder on the state of your athletes. These are body weight, heart rate at rest, and the wellness test. There is a great correlation between them, since when the body weight decreases, well-being usually does as well and the pulsations at rest tend to rise or vice versa. This can yield many clues for adjusting the amount of training. Monitoring the above data along with other objective measures such as performance in somewhat more sport-specific actions such as a sprint or vertical jump could be more than enough to know the state of your athlete.
Despite this, you will not be able to fully adapt to the athlete’s situation if you do not self-regulate with subjective data with a linear encoder. In fact, athletes adapt to different rates and magnitudes, so a perfect workout for one athlete may not be for another.
What is self-regulation?
Self-regulation within a strength program can be defined as the adjustment of training variables to individualize stressors (volume, intensity, nature of effort, etc.) in order to achieve optimal adaptations.
For example, an athlete with a higher functional reserve range (Beats at lactate threshold – Beats at rest) than another, will be able to recover better and faster from a workout, and will be able to endure greater volume. Remember that all energy systems depend on the aerobic system. Therefore, applying a velocity loss of 15% with the same % of the RM for both entails a different training volume, since, although the series will stop reaching the same percentage of velocity loss, the repetitions performed until losing that velocity will be different in each athlete (greater in the athlete with greater work capacity). Imagine, prescribing the same rep ranges and fixed load in both cases. The athlete with less work capacity is likely to end up with much higher fatigue, reaching intensities closer to failure, and, therefore, producing different adaptations.
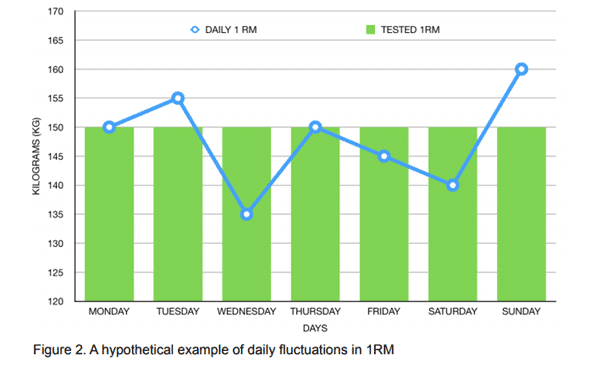
In addition, the maximum load that a given athlete will be able to lift during a single repetition maximum (RM) can change from one training session to another (2)
Therefore, self-regulation is nothing more than applying the principle of individualization in all our athletes.
How? Types of self-regulation:
There are different ways of self-regulation and all of them have advantages over the classic prescription by percentages.
Ratio of perceived exertion (RPE), repetitions in reserve (RIR) or velocity-based training (VBT) are presented as optimal ways of self-regulation.
The RPE is the subjective measure of the intensity of an exercise through a numerical scale from 1 to 10 (1 = very easy; 10 = maximum effort) (3). This marker has been shown to have a good correlation with the intensity of the effort (4,5,6) and also has presented a slight advantage over the training based on percentages (11)
The RIR is a subjective measure of an exercise in relation to the RPE but uses a scale to quantify the number of repetitions achievable before failure (RIR 0 = no repetition achievable at the end of the set; RIR 2 = 2 or 3 repetitions can be reached before of the failure). The RIR based on the RPE scale is a practical method of regulating the daily training load and providing information during a 1 RM test (7). Furthermore, it is presented as a superior way of prescribing training against a fixed load ( 10)
VBT is an objective measure that quantifies the velocity at which a load moves through technology (3). In addition, the velocitys used sit within a range corresponding to 1 RM (8) Due to the nature of being an objective measure, it can help determine the appropriate load for an individual and provides immediate feedback that can play a role in motivation. and improve performance (9)
Objective self-regulation (VBT) has been shown to be superior to other forms of subjective self-regulation (RPE) (12). The encoder will provide you with reliable information instantly. However, it will be the decision making based on the data provided by the device that will make this self-regulation method really effective.

In my opinion, integrating both forms of self-regulation (VBT and RPE) might be a better option since velocity-based training also has its limitations. This occurs because performing series with a certain percentage of velocity loss will bring your athletes closer and closer to failure. The average propulsive velocity of the first repetition of the first series will always be greater than the average propulsive velocity of the first repetition of the last series. Let’s take a hypothetical example, for a 40% velocity loss:
- Highest velocity of the first series: 0.55 m / s
- Highest velocity of the last series: 0.45 m / s
Applying a 40% velocity loss:
- The first set will stop when repeats are performed at 0.33 m / s
- The last set will stop when repeats are performed at 0.27 m / s
Therefore, the athlete will be reaching higher levels of fatigue in the last series than in the first and neuromuscular adaptations may not be the ones sought. In fact, using a 40% velocity loss during 3-4 sets with 75-80% in trained athletes led to failure in 53% of the sets (20)
To overcome this limitation, the relationship between the mean concentric velocity (ACV) and the RPE arises, stopping the series when the mean concentric velocity reaches a certain value of the RPE (21, 22):
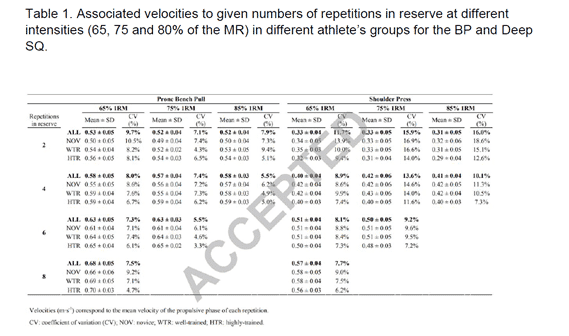
- This relationship remains constant throughout the series (presenting a variation of 0.06 m / s, considered as the smallest change for the ACV). In fact, it has been proven that there are no significant changes in stroke for RIRs 1, 4, 6 and 8 during sets carried to failure with 65.75 and 80% of RM in the bench press and squat (22)
- This relationship is different for the different exercises (21,22)
Tracking velocity to determine proximity to failure with the ACV-RPE ratio can help you quantify fatigue and effort more precisely (22)
Is the mean concentric velocity more accurate than the mean propulsive velocity?
García-Ramos (20) recommends ACV to monitor the relative load (% 1RM) in the bench press. However, as we will see, this is not because the ACV is more reliable as it presents a more linear trend, but rather that this more linear trend is due to a lower sensitivity to detect changes in performance.
In most resistance exercises, the movement begins at 0 velocity, reaches peak velocity at an intermediate time within the concentric phase, and finally returns to 0 m / s. Consequently, an important aspect to take into account when monitoring velocity in isoinertial exercises is that a considerable portion of the concentric phase is destined to decelerate the movement (23).
In fact, during the execution of exercises with light and moderate loads, the deceleration is of greater magnitude. During this final phase the force applied by the athlete against the external load is negative (the force only becomes negative when the acceleration applied to the mass is less than the acceleration applied by the force of gravity) (23)
Therefore, the concentric phase of a lift can be divided into a propulsive phase and a breaking phase.
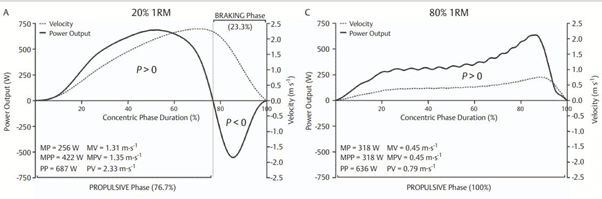
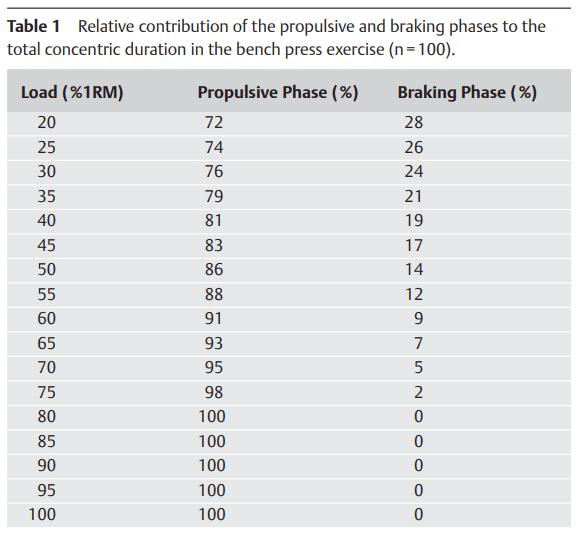
For 20% of the maximum repetition, the breaking phase represents 23.7% of the concentric phase. However, for 80% of the 1RM, the propulsive phase represents the entire concentric phase. This may be due to the lack of need to slow down the load due to the velocity being much lower than the velocity performed at 20%
As the force and power are negative during the breaking phase, the average power during the concentric phase represents 40% less than the average propulsive power (256 vs 422 W respectively with 20% of the 1RM). This difference between the mean power (MP) and the mean propulsive power (MPP) decreases with the% increase of the RM due to the decrease in the breaking phase (318 vs 318 W respectively with 80% of the 1RM)
This is the reason why García Ramos has found a more linear relationship and proposes the average velocity as a more reliable parameter. By taking into account the breaking phase the ability to discriminate performance decreases.
When does the breaking phase cease to exist in the bench press?
- 76.1 + -7.4% or an average velocity of 0.53 + – 0.07 m / s
Average velocity vs. average propulsive velocity in athletes with different maximum forces.
We can better discriminate the differences between athletes with different levels of force by following the average propulsive velocity than by following the average velocity.
As you are likely to use loads below 76% of 1RM, the breaking phase can affect the Speed-RPE ratio. For this, I recommend that you choose the average propulsive velocity to obtain more accurate data.
References:
- García-Ramos A, Pestaña-Melero FL, Pérez-Castilla A, Rojas FJ, Gregory Haff G. Mean Velocity vs. Mean Propulsive Velocity vs. Peak Velocity: Which Variable Determines Bench Press Relative Load With Higher Reliability? J Strength Cond Res. 2018 May;32(5):1273-1279. doi: 10.1519/JSC.0000000000001998. PMID: 28557855.
- M. Hickmott L. RELATIONSHIP BETWEEN VELOCITY AND REPETITIONS IN RESERVE IN THE BACK SQUAT, BENCH PRESS, AND DEADLIFT [Grado]. Florida Atlantic University; 2020.
- Morán-Navarro R , Martínez-Cava A, Sánchez-Medina L, Mora-Rodríguez R, González-Badillo JJ and G. Pallarés J. Movement velocity as a measure of level of effort during resistance exercise. Journal of Strength and Conditioning Research Publish Ahead of Print DOI: 10.1519/JSC.0000000000002017
- Sanchez-Medina L, Perez CE, Gonzalez-Badillo JJ. Importance of the propulsive phase in strength assessment. Int J Sports Med. 2010 Feb;31(2):123-9. doi: 10.1055/s-0029-1242815. Epub 2009 Dec 17. PMID: 20222005.