3 de June de 2023
RPE in Powerlifting vs Velocity Based Training (VBT)
Powerlifting is a sport that has gained a significant number of followers in recent years. This sport, which was virtually unknown in the 1990s, reached its peak in the early 2000s and now, in 2023, it has become a social phenomenon. I’m sure you’ve seen people in your gym performing the fundamental exercises (squat, deadlift, and bench press) every day. They are usually recognizable by their large helmets, sweatshirts, knee pads, and their ability to lift heavy weights.

Powerlifting is a sport that has gained a significant number of followers in recent years. This sport, which was virtually unknown in the 1990s, reached its peak in the early 2000s and now, in 2023, it has become a social phenomenon. I’m sure you’ve seen people in your gym performing the fundamental exercises (squat, deadlift, and bench press) every day. They are usually recognizable by their large helmets, sweatshirts, knee pads, and their ability to lift heavy weights.
As it is a relatively “new” sport, there hasn’t been an exhaustive study conducted on it. However, there are increasingly more authors conducting research and providing guidance on powerlifting training methods and how to achieve new personal records in the three basic exercises. In today’s post, we will focus on determining the most effective methodology for quantifying powerlifting workouts. We will compare two methodologies known as RPE (Rating of Perceived Exertion) and Velocity Based Training (VBT)
I must emphasize that RPE works by measuring the subjective perception of the athlete during training or exercise, while VBT provides an objective quantification of the speed at which the athlete moves the training load. In other words, although we want to compare both methodologies, they are completely different and often serve different purposes. However, in this case, they will both be used to determine the training load. If a powerlifter reports a squat intensity of 10 when I have programmed for an 8 in today’s session, I will need to decrease the load. On the other hand, if I set a load that my powerlifter should be moving at 0.85 m/s and they are moving at 0.60 m/s, it means once again that I should lower the load.
What’s RPE in Powerlifting?
As we mentioned, the RPE scale helps us assess the subjective perception of effort before an exercise or training session. In powerlifting, it can be a useful tool for determining if the workouts are too demanding or if they don’t reach the desired intensity. The RPE scale, also known as the Borg scale, was originally developed to gauge the subjective perception of exertion during aerobic exercise (1, 2). This scale originally ranged from 6 to 20, with the aim of correlating the number on the scale with the person’s heart rate. For example, an RPE score of 6 might correspond to a heart rate of 60-70 beats per minute, while a score of 20 indicated that the person was nearing their maximum heart rate (i.e., around 200 beats per minute).

However, it is important to note that while the RPE scale was initially developed and is commonly used to measure aerobic efforts, it can also be applied to assess the effort in strength training. It can help categorize the effort of one exercise relative to another and provide an overall assessment of training intensity. One key aspect of the RPE scale is the timing at which the athlete is asked to rate their subjective perception of effort. For instance, in the context of a powerlifting session, the timing of when we ask for the RPE can significantly impact the reported rating. If we ask for the RPE immediately after the completion of a challenging repetition, where the athlete is nearing failure, the RPE will likely be very high. However, if we wait until the end of the entire workout, after the athlete has had time to shower, change, and recover, the perceived exertion may be considerably lower. Therefore, in powerlifting, it is crucial to pay close attention to when we elicit the RPE rating to ensure its accuracy and relevance.
How Does Powerlifting Scale Work?
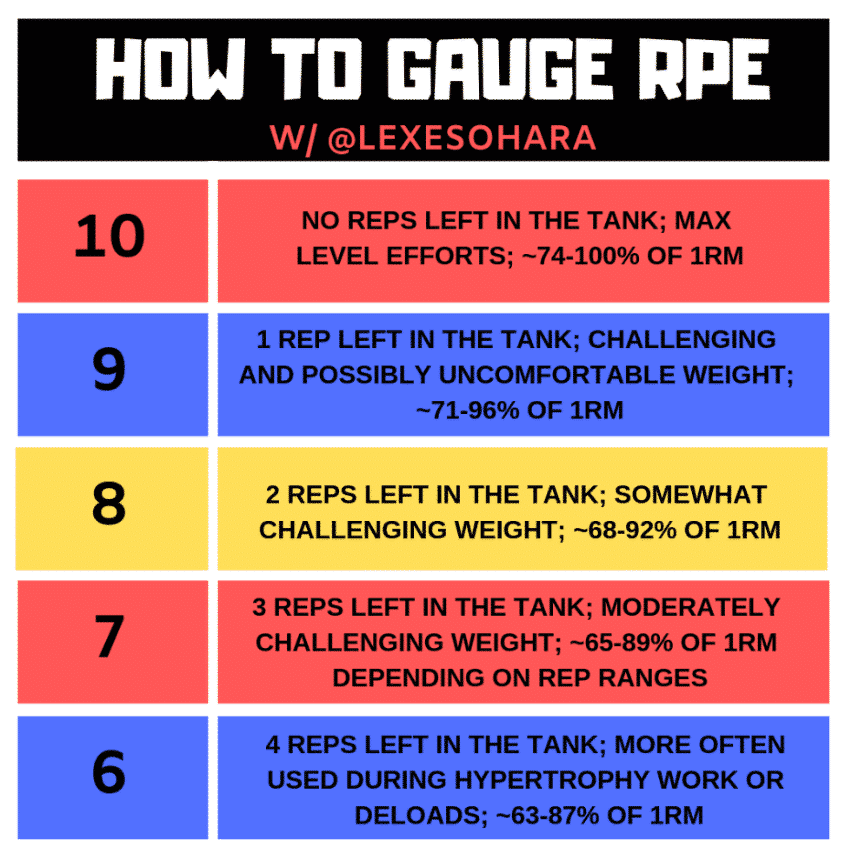
We have already mentioned that the first time the RPE scale was used was to measure aerobic exercise. However, today the RPE scale is also used in a sport such as powerlifting. Here is an example of a scale that is used with a powerlifter. The first thing is to determine that the scale goes from 0 to 10:
- 1-4: A light weight is used primarily for mobility improvement, recovery after a competition, or post-injury rehabilitation.
- 5: This weight is utilized for warm-up purposes. It generates a mild muscular contraction but at a very low intensity.
- 6: It is a weight that can be lifted with high speed, leaving approximately 8-9 repetitions “in the tank.”
- 7: This weight is ideal for developing power and also promotes muscle growth. It is a moderate weight allowing for 5 to 7 repetitions.
- 8: The intensity is high, and you can perform 2 to 4 repetitions with proper warm-up.
- 9: It is estimated that 1-2 repetitions can be performed with very high intensity. It is not maximum intensity, but it is close.
- 10: This weight equals your one-repetition maximum (1RM), representing the maximum weight you are able to lift.
This is a rough guide on how the RPE scale can be used in powerlifting. It should be noted that powerlifters need to familiarize themselves with this RPE scale and that you cannot use it lightly or prescribe workouts based on this RPE if you are not in control of your methodology.
Understanding & Utilizing RPE in Training
The RPE scale is an easy-to-use tool available to any coach, but as I have previously pointed out, familiarization with the tool is necessary (3). In order to implement the RPE as a means of calculating the training volume in our powerlifters, the coach must first be familiar with this tool. With the analysis that we have done previously, they have to experience what is a 4 in the RPE, an 8, or a 10. If the coach does not know the sensations that define each number, it is difficult to use and interpret it in powerlifting training. Here are some other examples of RPE in powerlifting:
That’s why the first thing to do in order to use RPE effectively is for the trainer to figure out the weights that they know should feel like a 3, a 6, an 8, and a 10 on the RPE scale. Once the powerlifter does these exercises, we’ll ask them how hard they think it was. For example, let’s say I think the powerlifter should rate a weight of 100 kg as an 8/10, but they say it was a 10/10. That means they’re not yet familiar with the scale. On the other hand, if the athlete can accurately match each sensation with its number, it means they know how to use and understand the scale. But if there’s a difference between what we expect and what the athlete says, it means they’re not yet used to the scale.
Advantages & Disadvantages of Using RPE in Powerlifting
The biggest advantage, in my opinion, of using the RPE scale is that it allows a powerlifter and coach to work together seamlessly. As a coach, there’s nothing better than being able to tell your powerlifter to perform a set at an 8/10 intensity and precisely know the appropriate load and how it should feel.
Another significant benefit is that the RPE scale doesn’t require any additional equipment. It can be utilized anytime, anywhere, providing valuable insights into the powerlifter’s experience. In fact, it’s particularly useful in competitions because, when used effectively, it can assist in achieving record-breaking performances or being mindful of weight fluctuations.
But not everything is entirely positive. In fact, the main limitation of the RPE scale is that it can occasionally be unreliable since it relies on the subjective perception of the individual. Let’s imagine a scenario in a competition where the powerlifter indicates that their first lift was a 7/10 in terms of effort. Based on this, we decide to increase the weight by 10 kg, assuming there is room for improvement. However, during the subsequent attempt, the powerlifter is unable to move the load. This would not only result in a failed lift but also contribute to accumulated fatigue for the following attempts.
Such situations highlight the potential drawback of relying solely on subjective perception without considering other factors that can affect performance. Therefore, it is essential to strike a balance between the powerlifter’s perception and objective indicators such as technique, fatigue levels, and previous performance, to make informed decisions and avoid potential pitfalls.
When Should a Powerlifter Use The RPE Scale or VBT?
This question is challenging to answer as there is no exact response. The main challenge with VBT is that it requires having the device readily available, charged, with battery life, positioned correctly, and, if immediate feedback is desired, a quiet environment to perceive execution speed. All of these factors can sometimes pose difficulties in a conventional gym setting. On the other hand, RPE requires nothing more than a good understanding of the tool and sometimes a paper template for the athlete to report the number.
In my opinion, VBT is a valuable system for load control, especially at the beginning of the season, allowing the powerlifter to assimilate the sensations from the previous year. It can even be used in conjunction with the RPE (4). In fact, the Vitruve blog recommends not limiting oneself to only one of these methodologies, as both are complementary and provide valuable training information.
If we aim for more specific and comprehensive control of training load, utilizing the Vitruve linear encoder and basing our training on VBT is the best option. As previously mentioned, we can incorporate the RPE system alongside VBT, but when the device indicates a loss in speed, the set is concluded. Typically, speed correlates with the perceived effort and athlete’s sensations, making it beneficial for familiarizing oneself with RPE.

RPE or RIR?
The RIR, which stands for “Repetitions in Reserve,” is another way to subjectively gauge effort. It originated from English terminology, indicating the number of repetitions one could still perform before reaching failure. For example, if you set a target of 10 repetitions with an RIR of 5, it means you could potentially complete up to 15 reps, but not more. Similarly, if you perform 10 reps with an RIR of 1, it signifies that you could manage a maximum of 11 reps.
When comparing both tools for controlling training load, I wouldn’t lean towards one over the other. I mean, both can be highly beneficial and aid in managing the training load effectively. In recent years, RIR has gained popularity, but in the research realm, RPE still remains the primary method for training assessments.
RPE or VBT?
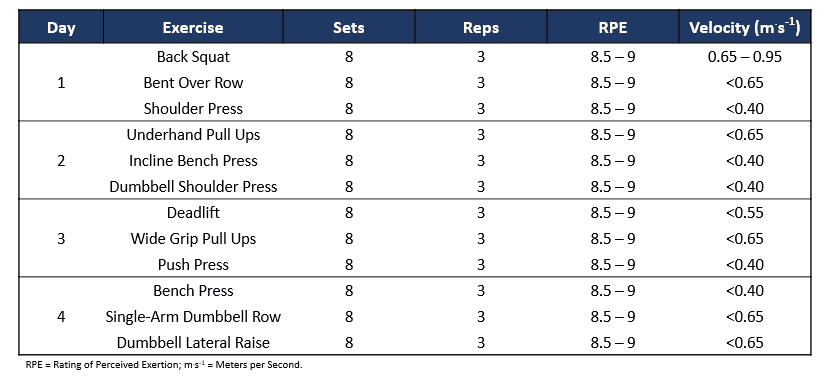
A recent study conducted a comparison between RPE and VBT in terms of calculating training load and their potential impact on a 12-week training program. The study involved twenty rugby players who were divided into two groups: one group trained using the RPE scale, while the other group utilized VBT. The training program consisted of two 6-week mesocycles, with one mesocycle targeting speed strength improvement and the other focusing on maximal strength development. Each training session was based on either a predetermined RPE or a programmed execution speed, and the participants’ Repetition Maximum (RM) was measured across various exercises. The tables displaying the RPE and VBT data are presented below.
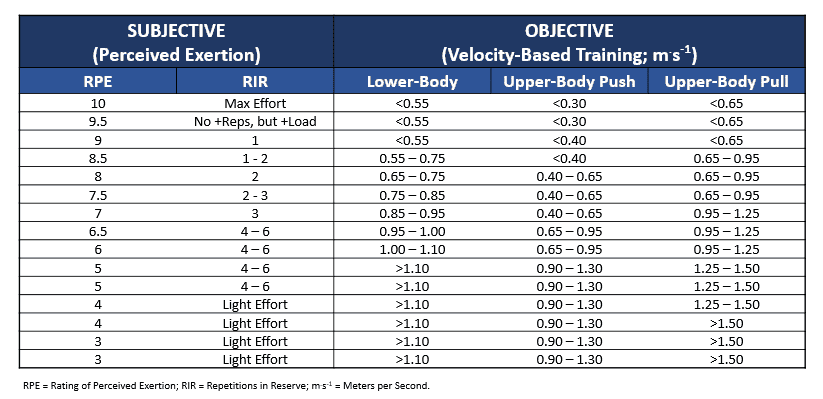
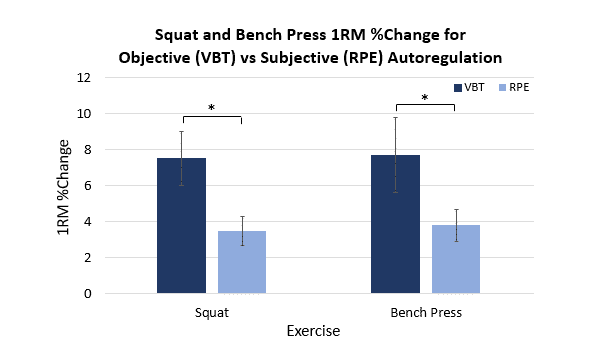
The study findings clearly indicate that velocity-based training (VBT) is more effective than RPE for enhancing Repetition Maximum (RM). The image below demonstrates a remarkable improvement in both the squat and bench press (two key powerlifting movements) when utilizing VBT compared to RPE.
Why VBT Could Help Powerlifters?
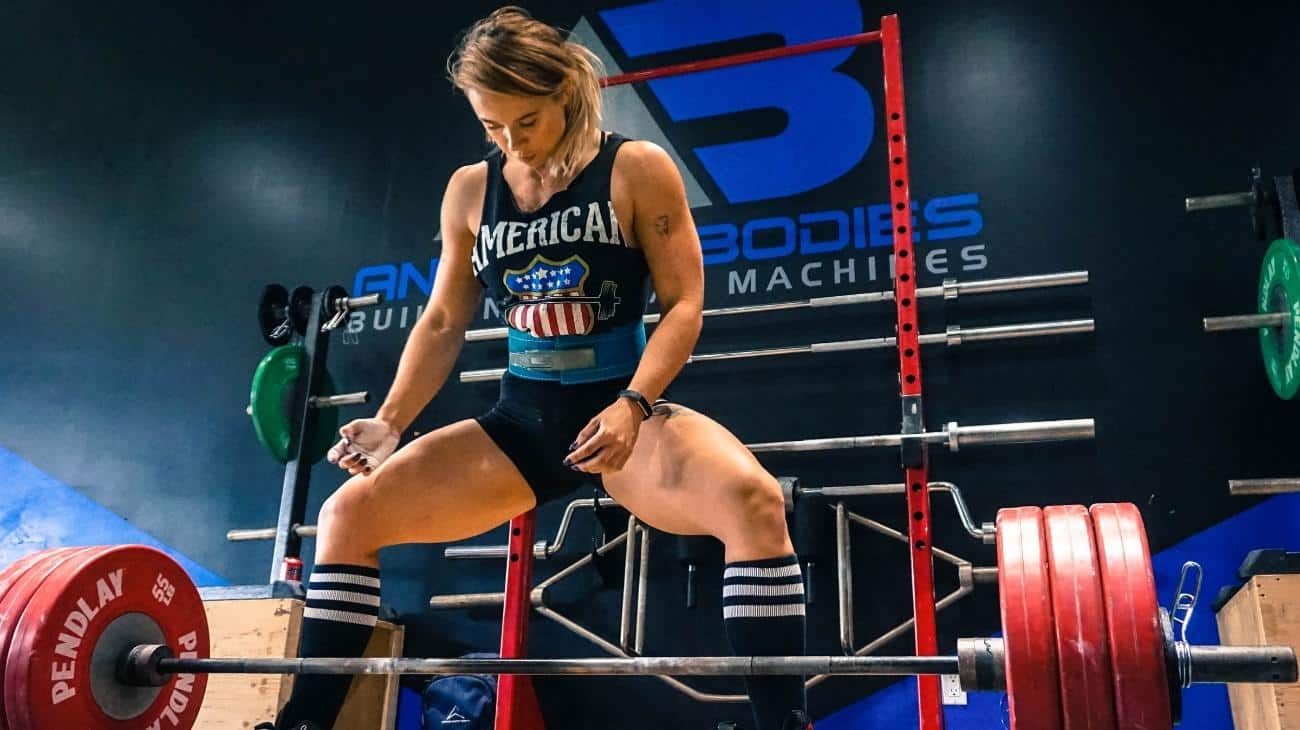
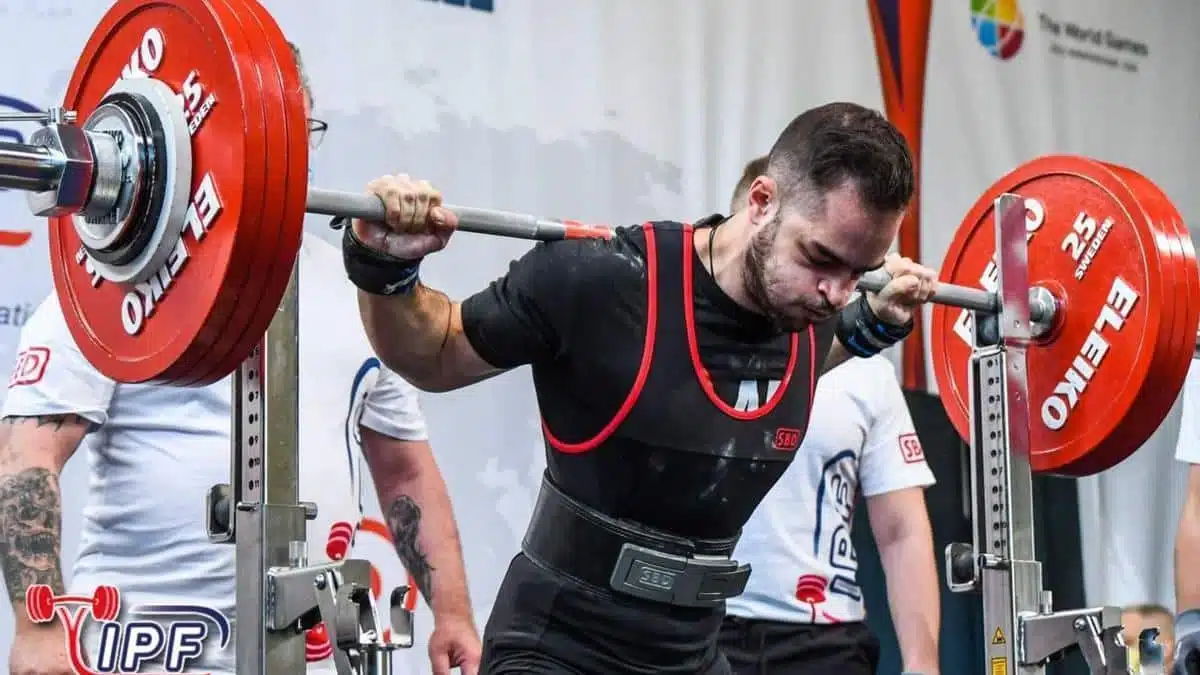
To address this question, let’s first define the key exercises performed by powerlifters. These exercises include the deadlift (involving multiple muscle groups for pulling), the squat (primarily targeting the lower body for pushing), and the bench press (focusing on pushing the upper body). Once these exercises are established, it is important to note that powerlifting competitions have specific rules that dictate how these exercises are executed. For instance, during the bench press, powerlifting rules mandate that the barbell must touch the chest while maintaining back and buttock support on the bench. However, the rules do not specify anything about the curvature of the back. As a result, powerlifters often exhibit variations in their positioning during the bench press, deviating from what is commonly seen. Nevertheless, the differences in positioning between powerlifters are not as significant in the other two exercises as they are in the bench press, as depicted in the image.

So why can VBT help a powerlifter? According to current evidence, maintaining a specific velocity while overcoming a given load can contribute to various performance benefits. Additionally, real-time load monitoring allows me to understand when I am training a strength capacity that may not be of interest to me. Moreover, VBT provides valuable data for reviewing training intensity. The features of VBT that can favor powerlifters’ training are as follows:
- The instantaneous and objective feedback of each repetition.
- The estimation of the RM of each session.
- The control of the training zone to be worked on specifically.
- The use of an objective method for the quantification of the load.
Conclusion
Finally, I want to highlight the significant role of VBT. Speed-based training provides us with objective performance data. While it is the coach’s responsibility to leverage this data and help the powerlifter perform at their best, it is incomparable to have an objective system for quantifying training load compared to a subjective one.
In the beginning of this article, I emphasized the vast differences between a methodology based on the powerlifter’s subjective perception versus one that disregards feelings and focuses on objective data. Considering the results, if I had to choose a specific methodology, I would always opt for VBT, accompanied by RPE and occasionally RIR.
Unai Adrián Perez de Arrilucea Le Floc’h
Referencias
- Ritchie C. Rating of perceived exertion (RPE). Journal of physiotherapy. 2012;58(1):62.
- Williams N. The Borg rating of perceived exertion (RPE) scale. Occupational medicine. 2017;67(5):404-5.
- Helms ER, Brown SR, Cross MR, Storey A, Cronin J, Zourdos MC. Self-rated accuracy of rating of perceived exertion-based load prescription in powerlifters. The Journal of Strength & Conditioning Research. 2017;31(10):2938-43.
- Helms ER, Storey A, Cross MR, Brown SR, Lenetsky S, Ramsay H, et al. RPE and velocity relationships for the back squat, bench press, and deadlift in powerlifters. The Journal of Strength & Conditioning Research. 2017;31(2):292-7.
- Helms E. Using the Repetitions in Reserve-based Rating of Perceived Exertion Scale to Autoregulate Powerlifting Training: Auckland University of Technology; 2017.