30 de April de 2023
How is The Force-Velocity Curve Affected by Muscular Strength Training?
What’s The Force-Velocity Curve?
In 1938, Hill reported a relationship between force and velocity in frog skeletal muscle and this formed a hyperbole (Hill, 1938). Since then, many researchers in the field of exercise physiology have been studying how strength training affects such a relationship between force and velocity (Sugi & Ohno, 2019). Gregory Haff and Sophia Nimphius described the principles of power training in the prestigious Strength and Conditioning Journal (Haff & Nimphius, 2012). From that publication we are going to extract some figures to better visualize the complex information in this blog article. In the following figure we can observe a coordinate axis in which velocity is on the vertical axis and strength on the horizontal axis.
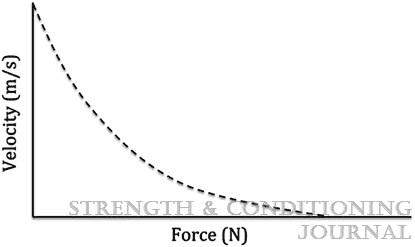
This image is simply used as an example, since we can also find the force on the vertical axis and the velocity on the horizontal, as well as one type of curves (Alcazar, Csapo, Ara, & Alegre, 2019). We can apply a given force at a given velocity. At the maximum peak velocity, the force will tend to zero, because we do not have time to apply much force. As the velocity is lower, the force we can apply is higher, reaching a limit where we find the maximum force with a minimum velocity: we move a considerable amount of load, but it moves very slowly.
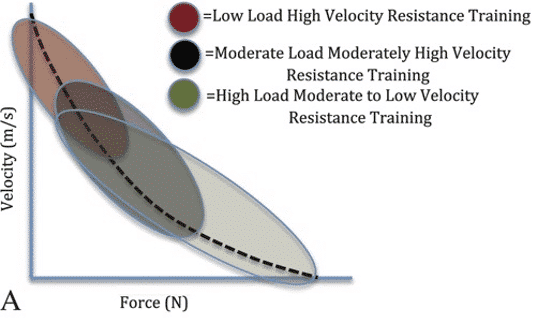
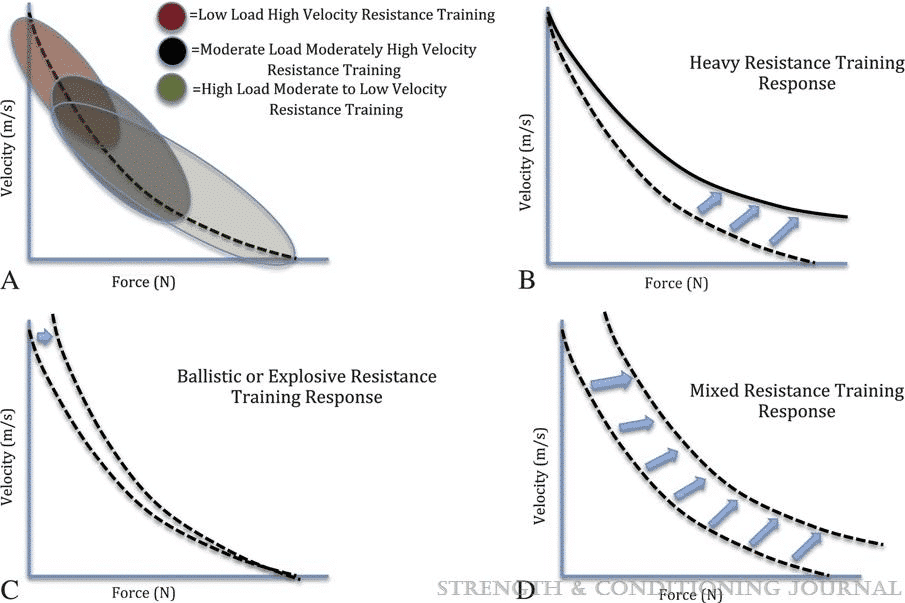
That force-velocity curve can be trained with different mixtures of load and velocity. In the curve shown in the figure below, we find three zones that are trained in three different ways: the zone in red, which is the one that allows us to execute the most velocity, is trained with low loads and high velocities; the zone in the middle is stimulated with moderate loads moved at moderate velocity; and the green zone is where we move high loads, but we cannot move them at high velocity.
Each athlete has a profile or force-velocity curve that informs the coach of the balance between the strength and velocity they can generate. In turn, each sport has a force-velocity curve that matches the needs of the sport (Cross, Brughelli, Samozino, & Morin, 2016; Giroux, Rabita, Chollet, & Guilhem, 2016). If the athlete’s profile matches that of the sport, they are said to have an optimal strength-velocity profile (Morin & Samozino, 2016). When both strength-velocity curves do not match, the athlete has either a strength deficit or a velocity deficit, depending on which quality needs improvement.
A common mistake coaches make is focusing on improving power without controlling the possible imbalance between the athlete’s strength-velocity profile, and the sport-specific strength-velocity curve. With training we can produce an increase in peak power, and yet have that increase not be translated into improved sport performance (Jimenez-Reyes, Samozino, Brughelli, & Morin, 2017). In fact, if a strength program increases maximal power while creating more imbalance in strength or velocity, it could even decrease performance in sport patterns such as a vertical jump (Jimenez-Reyes et al., 2017).
This is the main reason we must work on strength based on the strength-velocity curve presented by each athlete individually (Lindberg et al., 2021). The strength-velocity profile is overly sensitive to training with loads, but it must be “optimized training” or “individualized training based on strength or velocity imbalance” (Jiménez-Reyes et al., 2017). Throughout the article we will see how to train strength in the case of having a deficit on that side of the curve; how to train strength if we have a velocity deficit; and what to do if our athlete is close to the optimal profile of the sport.
“Optimized” or “Individualized” Training Based on Unbalanced Strength or Velocity
Strength training modifies the force-velocity curve (Andersen et al., 2005; Suchomel, McKeever, Nolen, & Comfort, 2022), especially if it is well designed. Jiménez-Reyes’ group compared an individualized training program based on the imbalance in everyone’s strength-velocity profile with a traditional training program in which everyone did the same thing (Jiménez-Reyes et al., 2017). In their research they evaluated the vertical jump, but it could be transferred to other ballistic gestures such as a punch in boxing, a bat in baseball, or a spike in volleyball, among many others. Their results leave no room for doubt: it is essential to pay attention to the force-velocity curve of each athlete for all of them to improve.
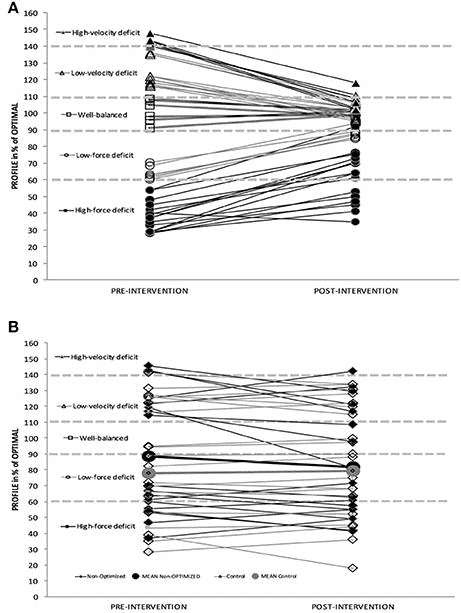
In the following image extracted from the publication by Jiménez-Reyes and collaborators, we can see the differences between group A and group B. In both groups the strength-velocity profile of the participants was measured, and it is shown in the left part of the lines, which is the time before the intervention. The aim is that after the intervention, the dates were directed to the intermediate zone, as is the case in group A, which is the ‘well balanced’ zone or zone of equilibrium without deficit. This well-balanced zone is the objective that the trainer should achieve with the strength sessions, as this will improve sports performance.
In group B, the image below the figure, we observe how most of the subjects continue with the same deficits after the intervention. The difference between group A and group B is that the training of the first group A was in accordance with their deficiencies, whether they were in strength or velocity, while in group B everyone trained the same, whether they were deficient in strength, velocity or were well balanced. In group A all the lines point to the same point, which is a balance of strength and velocity, indicating that the training has been effective. In group B, the subjects may have improved their strength or velocity, but they still show the same deficit as before.
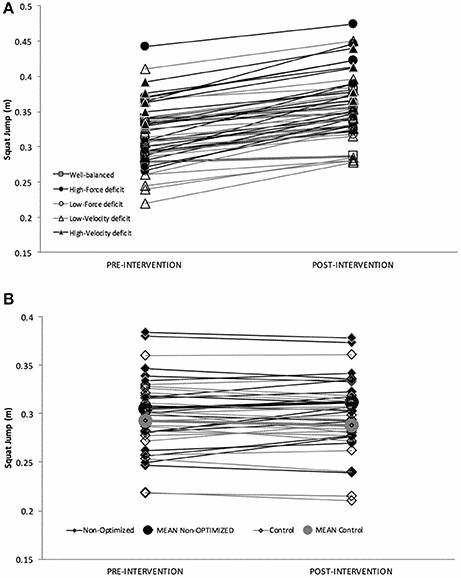
So many lines may have made a bit of a mess, but the following figure, also taken from the study by Jiménez-Reyes and collaborators, provides a better understanding. The final objective, beyond a deficit or not, was to verify the improvements in the vertical jump after the intervention of both groups: group A with individualized programming; group B with generic programming for all.
The result is noticeably clear: in group A, everyone improved their performance in the vertical jump, whether they had a deficit in one area or another. In group B, which conducted a general program, very few improved, a few remained the same as at the beginning and some even got worse. These results, as we have mentioned, can be extrapolated to the other sporting actions in which we manifest strength: hitting, throwing, mobilization of loads, etc.
Optimized Strength Training According to The Strength-Velocity Curve of Athletes
Athletes With Strength Deficits: High Force, Low Velocity Movements
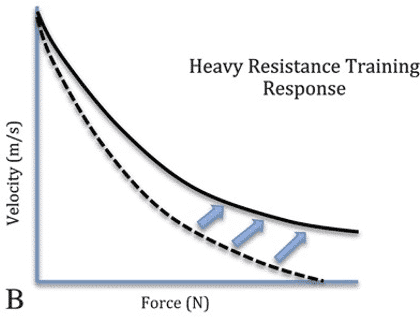
In the case of finding an athlete with a strength deficit, the coach’s goal is to improve that area of the strength-velocity curve. As shown in the image below, with the right training, we will modify our profile by raising the area where we need to improve the most.
Training to improve this zone of the force-velocity curve should have as its main objective to increase the maximum strength capacity, thus decreasing the imbalance that exists in that zone of the force-velocity curve (Jiménez-Reyes, Samozino, & Morin, 2019). The workouts in this case will be focused on moving high loads (>70% 1RM) to achieve maximal neuromuscular adaptations. This type of work can be summarized as moving high loads at low velocities.
This includes basic exercises such as squats, deadlifts, bench presses and others in which we can apply too much force, regardless of whether we move at low velocity. Of course, although from strength the barbell moves slowly, the athlete’s intention should be to move it as fast as possible.

Athletes With Velocity Deficit: Low Force, High Velocity Movements
At the other end of the force-velocity curve, when there is a velocity deficit, training should be directed towards that side of the curve, improving maximal velocity capabilities, i.e., the ability to produce force at exceedingly high contraction velocities. Sessions with this objective should be focused on moving low loads (<30% 1RM), since these are the ones that improve this side of the force-velocity curve (Jiménez-Reyes et al., 2019).
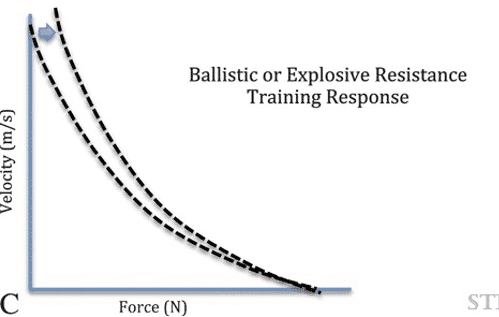
Athletes With a Large Velocity Deficit: Very Low Force Movements & Very High Velocity
Negative loads are also interesting when the velocity deficit is exceptionally large. This type of movement uses loads lower than the body mass, either with loads or with the help of elastic bands to generate velocities above those we could execute without them. A simple example is to perform vertical jumps grabbing an elastic band that increases the velocity with which we move in the jump. You can see how to do it in this video.
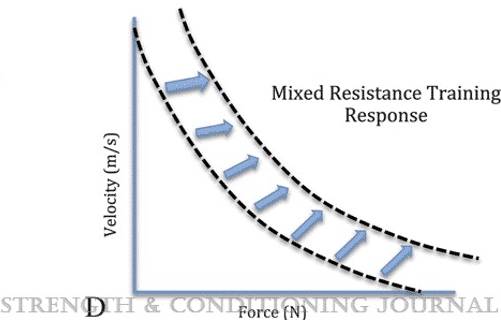
Balanced Athletes, Without Strength and Velocity Deficits: Medium Strength & Medium Velocity Movements
In the case of finding no deficit in the athlete, or that this is a low deficit with respect to the optimal profile for our athlete and sport, either strength or velocity, we will have to train with a balanced combination of strength, velocity and power to change the entire relationship of the force-velocity curve to the right. This is the most interesting part of the training, and the one we should focus on once we have controlled the possible strength or velocity deficit that the athlete came with.
Shifting the curve to the right means that the entire strength-velocity curve will have improved, both the velocity zone and the strength zone. That will clearly transfer into better performance in our sport, as we will apply more force and do it faster. Therefore, the first step is to eliminate the possible deficit in the strength or velocity zone, and once the athlete’s strength-velocity profile resembles the one required by the sport, we will shift that strength-velocity curve to the right. Every so often we will check that no new imbalances are created and continue to progress.
¿How do I Know That My Strength-Velocity Curve Profile Works for Optimal Training?
To obtain a force-velocity profile, we must have a reliable and valid velocity measurement device, such as Vitruve. This technology tells us the velocity at which we have moved the load in each repetition. By linking the load (force) and velocity, Vitruve’s own application will calculate your force-velocity profile. The test to build your profile is quite simple, as we simply need to do four movements, and they do not have to be maximal, as the traditional calculation demands.
After warming up properly, choose the four loads you are going to use in the test. Ideally, the loads should be between 35% – 80% of the 1RM, and the jumps from one repetition to another should be equal, that is, we should not increase in one jump by 10% and in another jump by 20%. You can use loads of 35%, 50%, 65% and 80% of 1RM. In the first two sets perform a couple of repetitions, because being low loads, the second repetition may be the fastest. In the last two sets do not fatigue and perform only one repetition. Each of the repetitions must be performed at the maximum possible velocity. If you do not meet this requirement, the test will not be valid.
Once you enter the loads and the velocity you have done it with (which you get thanks to Vitruve’s velocity measuring device), the application will give you your own strength-velocity profile. As we have described throughout the article, you should compare this profile with the strength-velocity curve of your sport, and train with loads and velocities that are focused on improving your deficit, if you have one. The Vitruve linear encoder will not only help you to calculate the profile, but you will be able to check how you are improving it with training.
Joaquín Vico Plaza
Bibliographical References
Alcazar, J., Csapo, R., Ara, I., & Alegre, L. M. (2019). On the Shape of the Force-Velocity Relationship in Skeletal Muscles: The Linear, the Hyperbolic, and the Double-Hyperbolic. Frontiers in Physiology, 10(JUN). https://doi.org/10.3389/FPHYS.2019.00769
Andersen, L. L., Andersen, J. L., Magnusson, S. P., Suetta, C., Madsen, J. L., Christensen, L. R., & Aagaard, P. (2005). Changes in the human muscle force-velocity relationship in response to resistance training and subsequent detraining. Journal of Applied Physiology, 99(1), 87–94. https://doi.org/10.1152/JAPPLPHYSIOL.00091.2005/ASSET/IMAGES/LARGE/ZDG0070539110007.JPEG
Cross, M. R., Brughelli, M., Samozino, P., & Morin, J. B. (2016). Methods of Power-Force-Velocity Profiling During Sprint Running: A Narrative Review. Sports Medicine 2016 47:7, 47(7), 1255–1269. https://doi.org/10.1007/S40279-016-0653-3
Giroux, C., Rabita, G., Chollet, D., & Guilhem, G. (2016). Optimal Balance Between Force and Velocity Differs Among World-Class Athletes. Journal of Applied Biomechanics, 32(1), 59–68. https://doi.org/10.1123/JAB.2015-0070
Haff, G. G., & Nimphius, S. (2012). Training principles for power. Strength and Conditioning Journal, 34(6), 2–12. https://doi.org/10.1519/SSC.0B013E31826DB467
Hill, A. V. (1938). The heat of shortening and the dynamic constants of muscle. Proceedings of the Royal Society of London. Series B-Biological Sciences, 126(843), 136–195.
Jiménez-Reyes, P., Samozino, P., Brughelli, M., & Morin, J. B. (2017). Effectiveness of an individualized training based on force-velocity profiling during jumping. Frontiers in Physiology, 7(JAN), 677. https://doi.org/10.3389/FPHYS.2016.00677/BIBTEX
Jiménez-Reyes, P., Samozino, P., & Morin, J. B. (2019). Optimized training for jumping performance using the force-velocity imbalance: Individual adaptation kinetics. PLOS ONE, 14(5), e0216681. https://doi.org/10.1371/JOURNAL.PONE.0216681
Lindberg, K., Solberg, P., Rønnestad, B. R., Frank, M. T., Larsen, T., Abusdal, G., … Bjørnsen, T. (2021). Should we individualize training based on force-velocity profiling to improve physical performance in athletes? Scandinavian Journal of Medicine & Science in Sports, 31(12), 2198–2210. https://doi.org/10.1111/SMS.14044
Morin, J. B., & Samozino, P. (2016). Interpreting power-force-velocity profiles for individualized and specific training. International Journal of Sports Physiology and Performance, 11(2), 267–272. https://doi.org/10.1123/IJSPP.2015-0638
Suchomel, T. J., McKeever, S. M., Nolen, J. D., & Comfort, P. (2022). Muscle Architectural and Force-Velocity Curve Adaptations following 10 Weeks of Training with Weightlifting Catching and Pulling Derivatives. Journal of Sports Science & Medicine, 21(4), 504. https://doi.org/10.52082/JSSM.2022.504
Sugi, H., & Ohno, T. (2019). Physiological Significance of the Force-Velocity Relation in Skeletal Muscle and Muscle Fibers. International Journal of Molecular Sciences, 20(12). https://doi.org/10.3390/IJMS20123075