24 de July de 2025
Athlete dashboards for coaches: track, compare, and optimize performance
Today, data is the backbone of every successful training plan. It’s the most effective way to evaluate whether your program is working—and to catch early signs of underperformance. But having accurate metrics is not enough. What truly matters is being able to visualize those metrics clearly and in context, so they can be applied to your athletes’ training programs.
That’s exactly where Athlete Dashboards come into play.
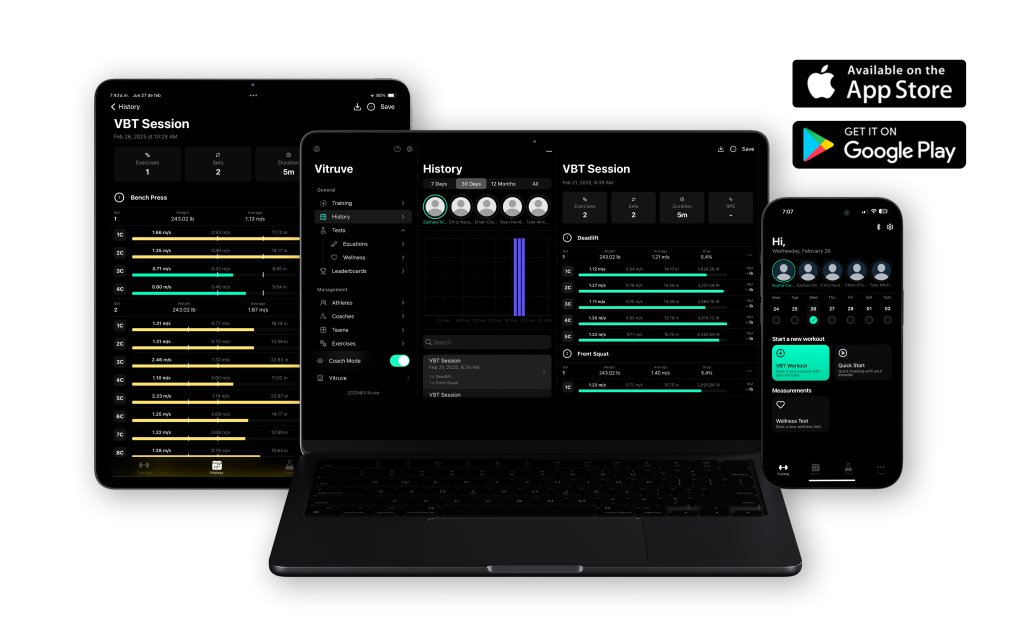
At Vitruve, we’ve spent years leading the way in Velocity Based Training (VBT) technology. Soon, we’ll launch Builder, a dedicated all-in-one software solution for coaches that transforms raw data into actionable insights—enabling custom dashboards, KPI tracking, and real-time adjustments.

What Is an Athlete Dashboard and Why Do You Need One?
An Athlete Dashboard is an intelligent monitoring tool that gives you a 360º overview of an athlete’s status, progress, and specific needs—whether it’s strength, mobility, power output, RSI, or position-specific performance metrics.
By centralizing the data collected during your sessions—e.g., via the Vitruve VBT encoder—the dashboard becomes the foundation of your programming decisions. For instance, it lets you see whether an athlete is plateauing in eccentric strength, or whether they’ve improved their vertical jump at the expense of joint mobility.
Key Benefits
- Compare against position-specific or team-wide benchmarks
- Identify trends over time
- Quickly highlight strengths and weaknesses
- Objectively track program effectiveness
KPIs That Truly Matter: What Should You Monitor?
While each sport, position, and athlete has unique needs, some key performance indicators (KPIs) should be at the core of any strength and conditioning dashboard:
Mobility & Asymmetries
Mobility deficits often underlie injuries and performance drops. Vitruve’s dashboards give you immediate insight into bilateral asymmetries (e.g., >10% as a red flag), as well as joint-specific mobility in the ankle, hip, shoulder, and more.
Strength & Power: In-Depth Segmentation
It’s not just about how much weight an athlete lifts—it’s about how they generate force. Are they stronger in the concentric or eccentric phase? Is their countermovement jump (CMJ) improving in height or in neuromuscular efficiency?
Dashboards allow you to compare different types of jumps or lifts (e.g., CMJ vs. squat jump) to better understand force production strategies.
Reactive Strength Index (RSI)
RSI is crucial for explosive sports performance. Calculated as jump height divided by ground contact time, it tells us how quickly and powerfully an athlete can respond after landing.
The dashboard tracks RSI progression over time and compares it to group averages or historical data. A low RSI could indicate fatigue or poor neuromuscular readiness.
Comparative Dashboards: going beyond the individual
One of the key features of Vitruve’s new software is the ability to go beyond individual analysis and generate cross-athlete comparisons. You can assess performance across an entire team, filter by position, age, or injury history, and detect recurring patterns.
This helps you intervene proactively, before injuries or performance declines occur.
Plus, dashboards come with automated alerts based on customizable thresholds. If any KPI drops beyond a set percentage of its historical average, the system flags it for review.

Clear (and Motivating) Progress Visualization
With clear, visual graphs and comparisons, Athlete Dashboards also help athletes understand their own progress—boosting both engagement and motivation, while facilitating feedback between coach and athlete.
You can visualize progress on KPIs such as:
- Average bar velocity in squats
- CMJ height
- Relative load in strength lifts
- RSI / Reactive stiffness
- Number of effective reps per session

S&C-Specific Software: The New Standard in High-Performance Coaching
With this new all-in-one platform, Vitruve is setting a new standard in Strength & Conditioning software—not just in VBT hardware.
This powerful combination lets you:
- Design fully individualized strength programs
- Auto-adjust loads in real time based on daily readiness
- Precisely monitor fatigue and recovery
- Visualize every key metric in custom dashboards
All of this is seamlessly integrated with our scientifically validated VBT tools, used by elite teams around the world.Forget about spending hours deciphering spreadsheets or guessing what’s wrong. With Vitruve, everything you need to plan, adapt, and maximize your athletes’ training is right at your fingertips.
