12 de November de 2024
Mean Velocity vs Mean Propulsive Velocity. Differences and Applications
Introduction
The effectiveness of resistance training (RT) in achieving specific goals relies on the appropriate manipulation of various variables that significantly affect both acute responses and subsequent physiological adaptations (Bird et al., 2005; Kraemer et al., 2002; Spiering et al., 2008). Training prescriptions must consider each variable based on the intended objective, with exercise intensity being a key factor influencing neuromuscular adaptations (Fry, 2004; Bird et al., 2005).
In this context, velocity-based training (VBT) emerges as an effective method for precisely adjusting training intensity daily. This approach is rooted in the pioneering study by Gonzalez-Badillo and Sanchez-Medina (2010), which established a relationship between the percentage of relative load (%1RM) in the bench press and mean propulsive velocity (MPV), demonstrating an R² value of 0.98. This finding allows lifting velocity to serve as an indicator of relative intensity, thereby eliminating the necessity for 1RM or xRM tests. Subsequent research has explored this relationship across various exercises, including full squats (Sanchez-Medina et al., 2017), prone pull-ups (Sanchez-Moreno et al., 2017), while also identifying sex differences to enhance control and individualization (Pareja-Blanco, Walker, et al., 2020). Thus, by measuring MPV, the %1RM can be automatically determined.
However, other studies suggest that measuring this relationship using mean velocity (MV) provides greater accuracy for general regression equations predicting relative load (%1RM) from movement velocity than MPV (Garcia-Ramos et al., 2018). This topic has generated considerable controversy within both scientific and professional circles. In this regard, the forthcoming text will address this issue and encourage reflection on which variable is more appropriate for quantifying intensity in various situations and contexts.

Importance of the Propulsive Phase
To determine which velocity should be used for predicting relative load (%1RM) or for detecting changes in performance due to increased execution velocity against any absolute load, we must first examine the paper of Sanchez-Medina et al. (2010).
The findings of the study by Sanchez-Medina et al. (2010) indicate that referring mean velocity values exclusively to the propulsive phase (MPV) when evaluating the velocity and power with which a load is lifted during a concentric action avoids underestimating an individual’s neuromuscular capacity, particularly when lifting light and moderate loads. In this sense, the propulsive phase is defined as the portion of the concentric phase during which acceleration (a) exceeds gravitational acceleration (i.e., a ≥ -9.81 m∙s⁻²). To understand these conclusions more clearly and practically, let us observe the following figures:
Figure 1. Concentric phase of one repetition with 20% 1RM in the bench press exercise
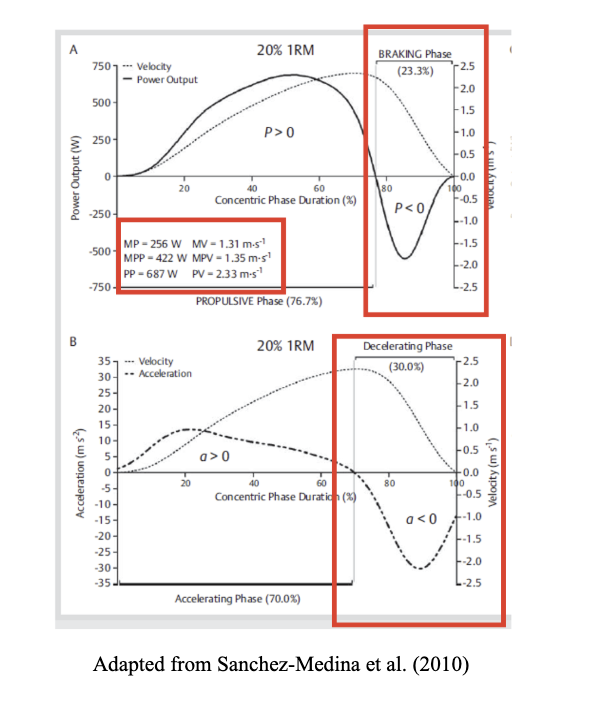
Figure 2. Concentric phase of one repetition with 20 kg (15.7% 1RM) in the bench press exercise
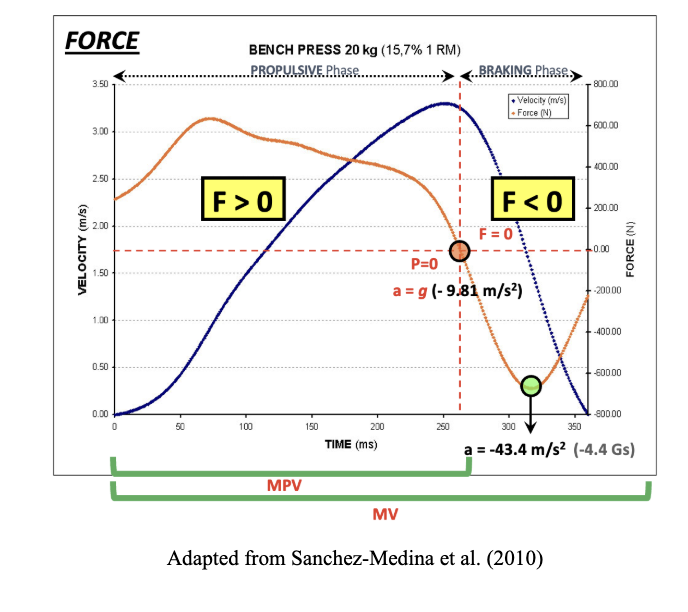
First, it is essential to distinguish between the acceleration phase, deceleration phase, propulsive phase, and braking phase during a concentric repetition of a specific exercise, in this case, the bench press, as employed in the study by Sanchez-Medina et al., (2010). In this exercise, the movement starts from a velocity of zero when the bar is resting on the chest, then reaches a maximum velocity during the concentric portion, and returns to zero when the elbows are fully extended and the bar is motionless, indicating that the concentric phase of that repetition has been completed. This behavior of velocity can be illustrated in Figures 1A and 1B at 20% 1RM (dashed points) and in Figure 2 at 15.7% 1RM during the bench press (blue line).
A critical consideration when lifting loads in typical isoinertial exercises at maximal intended velocity is that a significant portion of the concentric phase is spent decelerating the moving resistance. To observe this, we must first understand that force (F) is calculated as F = m · (a + g), where m is the moving mass (kg) and g is the acceleration due to gravity. Power production is the product of the vertical force applied and the velocity of the bar (P = F · v). In this regard, we can observe an acceleration phase comprising 70% of the concentric phase at 20% 1RM (Figure 1B). This acceleration phase refers to the portion of the concentric phase during which acceleration exceeds 0 m∙s⁻². This indicates the phase where the force applied is greater than the weight being lifted (in favor of the movement). This phase continues until the maximum velocity is reached. Conversely, the deceleration phase comprises 30% of the concentric phase at 20% 1RM (Figure 1B), referring to the portion of the concentric phase during which acceleration is less than 0 m∙s⁻². This means that the force applied is equal to or less than the weight being lifted (against the movement).
Considering that the acceleration phase lasts until the maximum velocity is reached, we can observe in Figures 1A, 1B, and 2 that even at this point of maximum velocity, there is still power (Figures 1A and 1B) and force application (Figure 2), indicating that the values of force, and consequently power, remain greater than 0. This implies that the propulsive phase lasts slightly longer than the acceleration phase, as the propulsive phase is defined as the portion of the concentric phase during which acceleration exceeds -9.81 m∙s⁻² (the acceleration due to gravity). Therefore, the propulsive phase would encompass the acceleration phase, where more force is applied than the load represents, and the portion where acceleration transitions from 0 to less than -9.81 m∙s⁻², which corresponds to the phase where the force equals the weight being lifted. Thus, while the acceleration phase in Figure 1B accounts for 70%, the propulsive phase would be 76.7% (Figure 1A). The remaining percentage corresponds to the braking phase, during which acceleration is less than -9.81 m∙s⁻², and therefore the force application opposes the movement, even though the bar continues to move until the repetition is completed (Figure 2). This movement occurs unconsciously to prevent the bar from being thrown.
In summary, if we were to obtain the MV of one bench press repetition, the velocity would be the average of all velocity values during the execution. However, the MPV would be the average of all velocity values from the start to the end of the propulsive phase.
Differences between mean velocity and mean propulsive velocity
Once we have understood the acceleration phase, deceleration phase, propulsive phase, and braking phase, we can examine how these phases affect a concentric action under different loads.
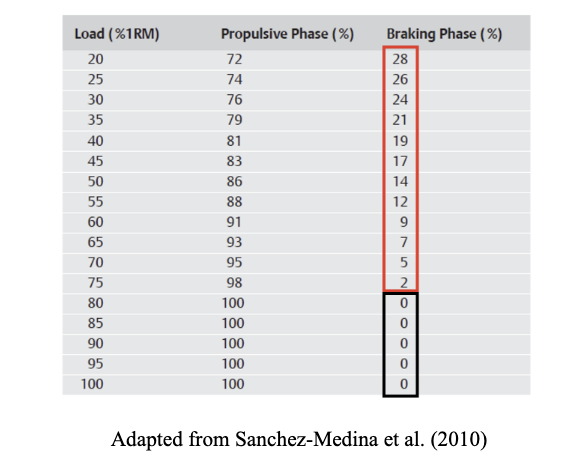
In this context, the braking phase has been shown to be greater when the load is lighter. This is because lighter loads allow for higher velocities, which in turn lead to a more pronounced braking phase (Figure 3).
Figure 3. Relative contribution of the propulsive and braking phases to the total concentric duration in the bench press exercise
As a practical example, we can refer to Figure 4, which depicts two concentric phases: one with a low load (20% 1RM) and another with a high load (80% 1RM). In this figure, we can observe that the Mean Power (MP) for the 20% 1RM load was 256 W, while the Mean Propulsive Power (MPP) was 422 W. This indicates that the MP over the entire concentric phase was 40% lower than the MPP for just the propulsive phase.
Figure 4. Concentric phase of one repetition with 20% 1RM and one with 80%1RM in the bench press exercise
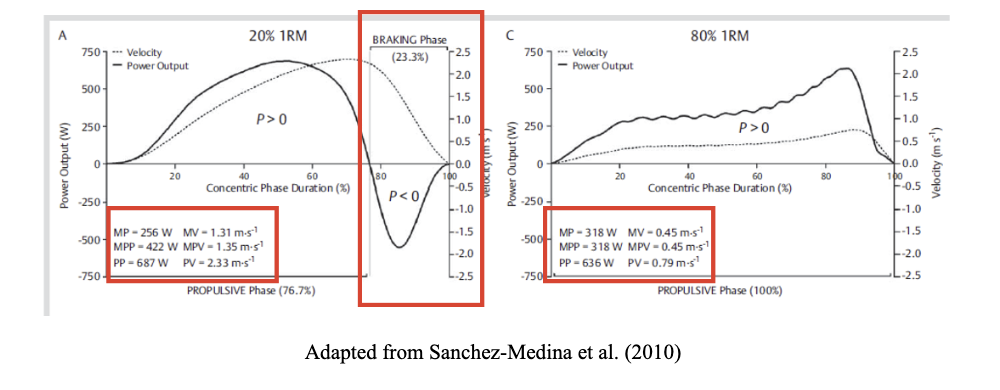
Conversely, these differences between MP and MPP did not exist when the load was at 80% 1RM, where both values were 318 W. This suggests that the disparity between these parameters gradually diminished as the lifted loads became heavier until reaching a point where the braking phase disappears and both parameters converge.
Specifically, in the bench press exercise, it was observed that the load at which the braking phase ceased to exist was 76.1 ± 7.4% 1RM, and the velocity at which the braking phase no longer existed was 0.53 ± 0.07 m∙s⁻¹ (Figure 5).
Figure 5. Relationship between the contribution of the propulsive phase to the total concentric duration of the lift and load (%1RM) (A); and mean propulsive velocity and contribution of the propulsive phase (B) in the bench press exercise.
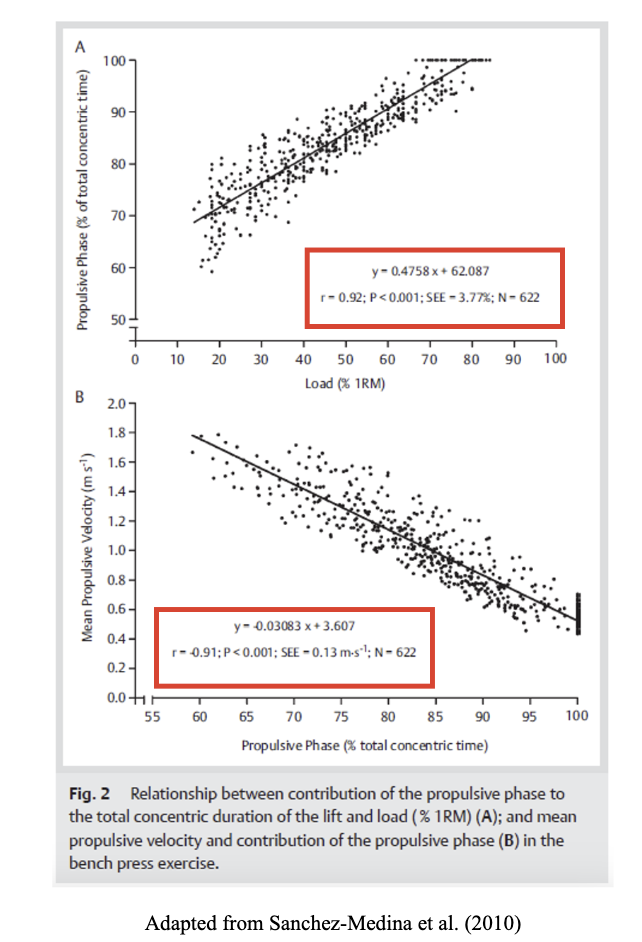
To summarize the paper of Sanchez-Medina (2010), when lifting light and moderate loads, there exists a final phase during which deceleration is of greater magnitude than would be expected solely due to the effect of gravity. This is the result of the athlete applying force in the opposite direction of the load’s movement.
Applications of mean velocity and mean propulsive velocity
Once the definition has been clarified, let us examine a practical example of how the choice of velocity can influence the observation of performance changes in a specific exercise.
In Figure 6, we can observe a real incremental test of progressive loads in the squat exercise, which provides insights into performance changes at low, moderate, and high loads.
Figure 6. Changes in squat performance (MPV and MV) after a resistance training program

From the solid lines in this image, we can conclude that the athlete has improved, as they are able to lift each load at a higher velocity (ranging from 20 to 100 kg with increments of 10 kg).
Furthermore, we can differentiate between MPV and MV (solid line vs. dashed line). When the loads are high, the velocities are quite similar; however, at lower loads, higher differences emerge between MPV and MV. This observation supports the discussion previously addressed regarding the propulsive phase under different loads.
Notably, the figure highlights that the changes in performance pre- and post-training are more pronounced when comparing MPV than when comparing MV. Additionally, if we examine the 70 kg load, we observe that in the pre-test there were minimal differences between MPV and MV, while this difference increases in the post-test. This is because in the pre-test, the load was not low enough to enable high-velocity movement, and for the braking phase to be longer. In contrast, in the post-test, the athlete has improved, and the absolute load of 70 kg represents a lower relative intensity, allowing for higher movement velocity and the presence of a braking phase.
In summary, using MV provides less sensitivity than MPV for detecting changes in performance. Therefore, if I want to truly understand the performance changes of my athlete, particularly at lower loads, I should opt for measuring MPV. Conversely, MV remains a viable option when observing performance changes at higher loads (where there is no braking phase) or when a device to measure MPV is not available.
Dr. Pedro Jesús Cornejo Daza
REFERENCES
Bird, S. P., Tarpenning, K. M., & Marino, F. E. (2005). Designing resistance training programmes to enhance muscular fitness: a review of the acute program variables. Sports Med, 35(10), 841-851.
Fry, A. C. (2004). The role of resistance exercise intensity on muscle fibre adaptations. Sports Med, 34(10), 663-679.
García-Ramos A, Pestaña-Melero FL, Pérez-Castilla A, Rojas FJ, Gregory Haff G. Mean Velocity vs. Mean Propulsive Velocity vs. Peak Velocity: Which Variable Determines Bench Press Relative Load With Higher Reliability? J Strength Cond Res. 2018 May;32(5):1273-1279.
Gonzalez-Badillo, J. J., & Sanchez-Medina, L. (2010). Movement velocity as a measure of loading intensity in resistance training. Int J Sports Med, 31(5), 347-352.
Kraemer, W. J., Ratamess, N. A., & French, D. N. (2002). Resistance training for health and performance. Curr Sports Med Rep, 1(3), 165-171.
Martinez-Cava, A., Moran-Navarro, R., Sanchez-Medina, L., Gonzalez-Badillo, J. J., & Pallares, J. G. (2019). Velocity- and power-load relationships in the half, parallel and full back squat. J Sports Sci, 37(10), 1088-1096.
Pareja-Blanco, F., Walker, S., & Häkkinen, K. (2020d). Validity of using velocity to estimate intensity in resistance exercises in men and women. Int J Sports Med , 41(14), 1047-1055.
Rodriguez-Rosell, D., Yanez-Garcia, J. M., Sanchez-Medina, L., Mora-Custodio, R., & Gonzalez-Badillo, J. J. (2020). Relationship Between Velocity Loss and Repetitions in Reserve in the Bench Press and Back Squat Exercises. J Strength Cond Res, 34(9), 2537-2547.
Sanchez-Medina, L., Perez, C. E., & Gonzalez-Badillo, J. J. (2010). Importance of the propulsive phase in strength assessment. Int J Sports Med, 31(2), 123-129.
Sanchez-Medina, L., Pallares, J. G., Perez, C. E., Moran-Navarro, R., & Gonzalez-Badillo, J. J. (2017). Estimation of Relative Load From Bar Velocity in the Full Back Squat Exercise. Sports Med Int Open, 1(2), E80-E88. https://doi.org/10.1055/s-0043-102933 (Estimation of Relative Load From Bar Velocity in the Full Back Squat Exercise.)
Sanchez-Moreno, M., Rodriguez-Rosell, D., Pareja-Blanco, F., Mora-Custodio, R., & Gonzalez-Badillo, J. J. (2017). Movement Velocity as Indicator of Relative Intensity and Level of Effort Attained During the Set in Pull-Up Exercise. Int J Sports Physiol Perform, 12(10), 1378-1384. https://doi.org/10.1123/ijspp.2016-0791 Spiering, B. A., Kraemer, W. J., Anderson, J. M., Armstrong, L. E., Nindl, B. C., Volek, J. S., & Maresh, C. M. (2008). Resistance exercise biology: manipulation of resistance exercise programme variables determines the responses of cellular and molecular signaling pathways. Sports Med, 38(7), 527-540.
