24 de June de 2020
How To Compare Athletes Based on their Load Velocity Profile
Velocity-based training (VBT) has gained a lot of attention in recent years as a valuable tool for strength and conditioning coaches, personal trainers and in the fitness and performance community in general. This training method uses technology such as accelerometers or linear position transducers, which have been shown to be more accurate, to measure movement velocity during an exercise (e.g., back squat, bench press, deadlift) 1,2.
Even though the technology behind it has been around for years, it was usually only seen in sports science labs and with applications mainly in the research area. But it was not until the last two decades or so that it has been exponentially popularized, mainly driven by the increased availability of affordable and easy to use VBT devices such as Vitruve.
However, it wouldn’t have been possible without the work of both researchers and strength coaches such as Bryan Mann, Eamonn Flanagan, Mladen Jovanovic and the Spanish legion (Gonzalez Badillo, Amador Garcia, Carlos Balsalobre, Pedro Jimenez Reyes, Michael Izquierdo and many, many more) who have shed much light on the topic, setting not only the theoretical basis but also the state of the art practical applications of VBT methods.
The first thing to consider is that VBT is based on the strong and stable linear and negative relationship that exists between load and mean concentric velocity (MCV) and this have been shown by a number of researches 3,4. So, as the load increases (as long as maximal intent to lift it as fast as possible is applied), the mean concentric velocity at which that load moves decreases in a linear fashion 5,6.
Example of Load Velocity Profile in Bench Press performed by a Youth Rugby Player (Measured via Vitruve VBT device, former Speed4Lifts).
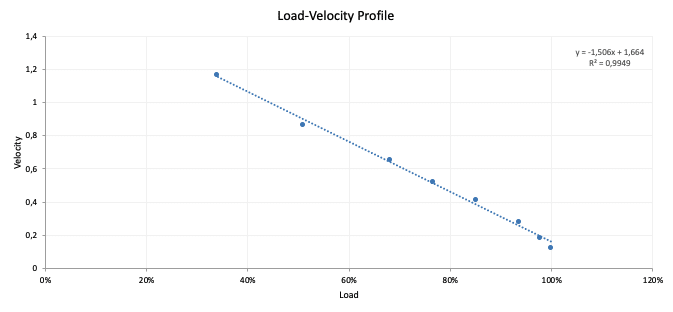 Figure 1 shows the aforementioned relationship between relative load, expressed as a % of 1RM, and MCV for the bench press. But let’s go deeper in understanding this kind of relationship.
What Is a Linear Relationship?
A linear relationship (or linear association) is a statistical term used to describe a straight-line relationship between a variable and a constant. Linear relationships can be expressed either in a graphical format where the variable and the constant are connected via a straight line or in a mathematical format where the independent variable is multiplied by the slope coefficient, added by a constant, which determines the dependent variable.
The Math behind Load Velocity Training
Mathematically, a linear relationship is one that satisfies the equation:
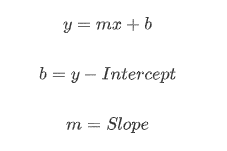
In this equation, “x” and “y” are two variables that are related by the parameters “m” and “b”. Graphically, y = mx + b plots in the x-y plane as a line with slope “m” and y-intercept “b.” The y-intercept “b” is simply the value of “y” when x=0. The slope “m” is calculated from any two individual points (x1, y1) and (x2, y2) as:

Among other things, linear equations can help us describe the relationship between two variables (like load and velocity), calculate rates (such as how fast the velocity decreases as load goes up), or “predict” the value of one variable from the data of the other (for example, predict 1RM load from the MCV of a sub max load).
When presented with a linear equation if we know the value of one of the variables, we can solve the equation for the other variable.
A Real Example of Load Velocity Profile
Let’s use the Load Velocity Profile equation shown in Figure 1 as an example. If we know the velocity (0,68m/s) at which we move a given load (80kg), we can solve for the % of 1RM (x) as follows:
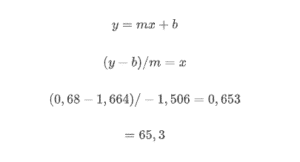
So, for that particular athlete and that particular exercise, 0,68 ms/s correspond to 65,3% of 1RM. We can do the same procedure to estimate 1RM but for that, we need to know the minimum velocity threshold for that exercise or base our model on the 1RM velocity published in the research, for example for the bench press it should be around 0,13m/s 7,8.
Load Velocity Curve
The Load Velocity Curve is a graphical representation of the inverse relationship between load and velocity and is based on the relationship between force and velocity. Taking into account the interaction between force and velocity and their influences on exercise selection is crucial for designing and implementing a successful training program.
The load velocity curve is simply a relationship between force and velocity and can, therefore, be displayed on an x-y graph. The x-axis shows either muscle contraction velocity or velocity of movement (meters per second). Whilst the y-axis indicates force, for example, this may represent muscle contractile force or the amount of ground reaction force produced (Newtons or Kg/F). A load velocity profile can also highlight individual athlete characteristics and individual strengths and weaknesses. It can emphasize areas along the load-velocity curve where a given athlete might be good at or not, information that a 1RM test alone will not provide, especially because improvements in different spectrums of the curve are training-specific9–11.
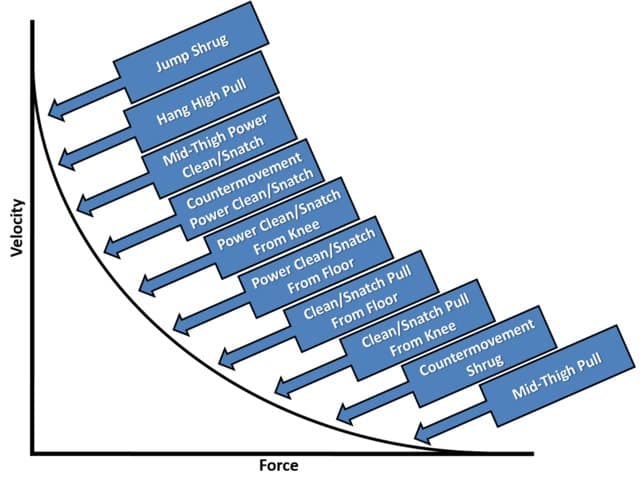 Figure 2: Force–velocity (power) curve with respect to weightlifting derivatives selection for specificity12.
But caution must be taken, even though it’s true that specificity of training will be a better approach, the promise that training at specific points of the load velocity curve will elicit better results with athletes is completely false and too simplistic. The sum and interaction of all training is the reason why some programs succeed, and some seem to struggle. Performance is a complex, chaotic outcome and even impossible to “model” but as George Box once said: “all models are wrong, but some are useful”12.
Comparing athletes characteristics
Getting back to the Load Velocity profile, the information given can be very useful for comparing athletes’ characteristics. By examining the slopes, we can see if individuals are more deficient in velocity or force and compared to group norms. Basically, it may provide some information on the strength qualities of the athlete. The steeper the slope, the more efficient the athlete in moving light loads at greater velocities and vice versa.
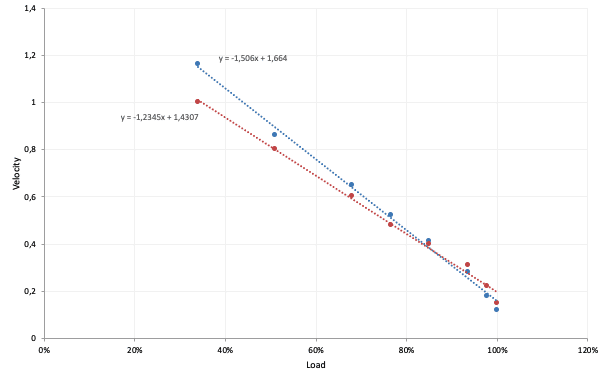 Figure 3. Comparison of 2 athletes Load Velocity Profiles for the Bench Press. Blueline athlete has a steeper slope (-1,506) which means he is more efficient than the Redline athlete (-1,2345) in expressing higher velocities with lighter loads.
Using the data from Figure 3, and not considering any other information (sport, position, individual characteristics, etc), red line athlete seems to need more light-load/high-speed training whilst Blue line athlete may benefit from more heavy-load/load-speed work. This is undoubtedly an area where more research is needed. However, logical training interventions can be made from profiling the load-velocity relationship.
This approach can be used to compare athletes against each other and also to make a pre vs post-training intervention comparison. Within a several-week training block, the relative loads at the corresponding velocities are the same, regardless of the changes in the absolute loads. As a result of a heavy strength training block, you should be able to achieve movement at slower velocities as your body has adapted to move these heavier loads.
Comparison of 3 different athletes Load Velocity Profile for Bench Press.
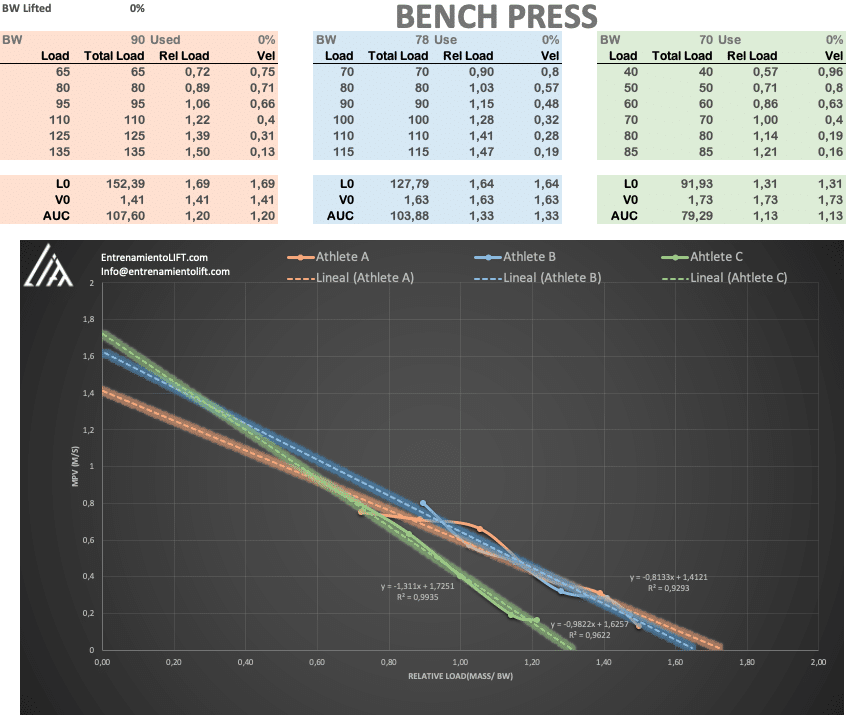 Figure 4 shows a deeper comparison of a Load Velocity profile for three different athletes.
Because we may want to compare athletes with different body weight, it´s recommended not using absolute loads but the relative load (simply dividing the external load by athlete´s body weight). As mentioned before, Green Line Athlete has the greatest slope (or smallest if we take into account that we are dealing with negative values) which means is faster than the others with light loads.
Additionally, we can perform some simple calculations taking advantage of the linear relationship of this model. L0 is the load “hypothetically” achieve with a velocity of 0 (that’s why is greater than 1RM) and V0 is the velocity achieved if the load is 0 which can also be calculated from the equation (y-intercept). With this information, we can calculate both absolute and relative area under the curve (AUC) which is a mathematical way of representing the whole Load Velocity relationship. This approach may be useful for pre vs post comparison but it also helps widen up the analysis and not only look to specific zones of the curve but also to the whole picture.
Practical Applications
I’ve mentioned before, it’s important to consider the complex nature of sports performance and not to oversimplify it. Complex systems — such as the human body and movement — are much more than an assembly of independent parts. Athletes are way more than the sum of their Load Velocity profiles and the devil is hidden in the details.
So, every little aspect may be relevant (for example novice athletes not familiar with proper lifting technique may not benefit as experience lifters using VBT13) and profiling an athlete should not be an isolated tool for either exercise selection nor load prescription.
- Force-velocity profiling could be a useful tool for testing, comparing and monitoring athletes.
- For complex movements, the force-velocity curve is specific to each particular movement.
- Every Model has limitations
- Excercise selections based on Load Velocity Profile is a solid approach but CONTEXT is always KEY.
How to Create a Load Velocity Profile in Vitruve Teams App
Bibliography
Pérez-Castilla, A., Piepoli, A., Delgado-García, G., Garrido-Blanca, G. & García-Ramos, A. Reliability and Concurrent Validity of Seven Commercially Available Devices for the Assessment of Movement Velocity at Different Intensities During the Bench Press. Journal of Strength and Conditioning Research 33, 1258–1265 (2019).
- Harris, N. K., Cronin, J., Taylor, K.-L., Boris, J. & Sheppard, J. Understanding Position Transducer Technology for Strength and Conditioning Practitioners. Strength and Conditioning Journal 32, 66–79 (2010).
- Conceição, F., Fernandes, J., Lewis, M., Gonzaléz-Badillo, J. J. & Jimenéz-Reyes, P. Movement velocity as a measure of exercise intensity in three lower limb exercises. Journal of Sports Sciences 34, 1099–1106 (2015).
- Jidovtseff, B., Harris, N. K., Crielaard, J.-M. & Cronin, J. B. Using the load-velocity relationship for 1RM prediction. Journal of Strength and Conditioning Research 25, 267–270 (2011).
- González-Badillo, J. J. & Sánchez-Medina, L. Movement Velocity as a Measure of Loading Intensity in Resistance Training. Int J Sports Med 31, 347–352 (2010).
- González-Badillo, J., Marques, M. & Sánchez-Medina, L. The Importance of Movement Velocity as a Measure to Control Resistance Training Intensity. Journal of Human Kinetics 29A, 15–19 (2011).
- García-Ramos, A., Jaric, S., Padial, P. & Feriche, B. Force–Velocity Relationship of Upper Body Muscles: Traditional Versus Ballistic Bench Press. Journal of Applied Biomechanics 32, 178–185 (2016).
- García-Ramos, A., Pestaña-Melero, F. L., Pérez-Castilla, A., Rojas, F. J. & Gregory Haff, G. Mean Velocity vs. Mean Propulsive Velocity vs. Peak Velocity. Journal of Strength and Conditioning Research 32, 1273–1279 (2018).
- Morin, J.-B. & Samozino, P. Interpreting Power-Force-Velocity Profiles for Individualized and Specific Training. International Journal of Sports Physiology and Performance 11, 267–272 (2016).
- Jiménez-Reyes, P., Samozino, P., Brughelli, M. & Morin, J.-B. Effectiveness of an Individualized Training Based on Force-Velocity Profiling during Jumping. Front. Physiol. 7, (2017).
- Haugen, T. A., Breitschädel, F. & Seiler, S. Sprint mechanical variables in elite athletes: Are force-velocity profiles sport specific or individual? PLoS ONE 14, e0215551 (2019).
- Box, G. E. P. Science and Statistics. Journal of the American Statistical Association 71, 791–799 (1976).
- Padulo, J., Mignogna, P., Mignardi, S., Tonni, F. & D’Ottavio, S. Effect of Different Pushing Speeds on Bench Press. Int J Sports Med 33, 376–380 (2012).

