23 de May de 2020
Individualized load-velocity profiles: Application considerations for increasing prediction accuracy
Individualized load-velocity profiles are commonly employed to predict 1RM. Nonetheless, the results are mixed: some studies demonstrate that they can accurately predict 1RM; however, other studies reveal the opposite. Join me as I address what are the individual subtleties that must be considered for application in order to increase the accuracy of 1RM prediction.
Key Points
- Individualized linear regression equations are the most common load-velocity profiles employed to predict 1RM
- The overall findings from the literature are mixed in terms of 1RM prediction accuracy
- There are several application considerations in order to increase 1RM prediction accuracy
When someone says, “Velocity-Based Training” what typically comes to mind for most individuals is Load-Velocity Profile. Next, most individuals typically think of a load-velocity profile as a regression equation involving velocity on the x-axis and load on the y-axis with an extrapolation of velocity in order to predict 1RM. Regression equations are typically used to predict 1RM in order to monitor 1RM over time or as a method in which to base the training session’s prescription. There are countless studies involving regression equation load-velocity profiles; therefore, rather than address every single study, this short review will provide a brief snapshot of the most important considerations and individual subtleties in order to increase 1RM prediction accuracy.
In summary, these studies investigate the validity and/or reliability of load-velocity profiles for 1RM prediction. Validity refers to the accuracy of 1RM prediction methods. Reliability refers to the consistency of 1RM prediction methods. It is important to investigate both validity and reliability, as a 1RM prediction method may be invalid (not accurately predict 1RM), but it may still be reliable, meaning that it consistently over- or under-predicts 1RM by a specific magnitude. For example, let’s say that a particular 1RM prediction method consistently over-predicts 1RM by 10 kilos. Although it is invalid (over-predicts 1RM by 10 kilos), it is reliable (it consistently over-predicts 1RM by 10 kilos). Therefore, in this particular example, this individual could still use this as a solid method to predict 1RM by simply knowing that their 1RM is always ~10 kilos less than the actual prediction.
Personally, I’ve played with both linear regression equations and polynomial regression equations a fair amount to predict 1RM. For myself, both methods tend to over-predict 1RM substantially, which is consistent with what is reported in most of the literature. For this reason, I typically suggest using what I’ve termed an Individualized First Rep Velocity Table in order to cross-reference your individualized first rep velocity with your individualized percentage of 1RM for accurate determination of what percentage of 1RM is on the bar and for accurate 1RM prediction. However, for some individuals I have found that the typical regression equation load-velocity profiles are able to predict 1RM with reasonably good accuracy, so I do still think that they are worth discussing. Simply keep in mind the important considerations illustrated below if you’re interested in giving them a shot.
What is the Best Velocity Metric to Use?
There are various velocity metrics that can be used to predict 1RM: average concentric velocity (ACV), mean propulsive velocity (MPV), peak velocity (PV), and numerous others (1). ACV is the average velocity during the entire concentric portion of the lift (i.e. during the portion in which you are ascending or “moving upwards” in the squat or the bench press). MPV is the average velocity from the initiation of the concentric portion of the lift to the point at which the acceleration of the bar is less than the acceleration of gravity (this can be particularly useful for assessing rate of force development; also commonly referred to as RFD). PV is the maximum (hence peak) velocity that is achieved during the concentric portion of the lift.
In a very recent study investigating which velocity metric could determine the relative load of the bench press with the highest reliability, ACV had the highest pearson correlation coefficient (R = 0.993) and the lowest standard error of the estimate (SEE = 5.11 – 6.03%) (1). The R value measures the strength of the relationship between two variables (load and velocity in this particular case) and ranges from -1.00 to +1.00 (an absolute value of 1.00 would indicate that there is a perfect correlation between load and velocity). The SEE represents the accuracy and illustrates the variation around a regression line (so the lower the SEE, the less variance and the higher the accuracy of prediction).
What is the Best Type of 1RM Prediction Method to Use?
There are three primary 1RM prediction methods using velocity that are presently employed within the scientific literature: minimal velocity threshold (MVT), load at zero velocity (LD0), and force-velocity (FV) (2). The MVT suggests that the final repetition prior to failure is always at the same ACV. Therefore, the MVT method involves solving the linear regression equation for y (1RM) with the MVT (x). The LD0 method is identical to the MVT method; however, it involves solving the linear regression equation for a velocity of 0 m.s-1, instead of the MVT. The FV method involves identifying the intercept between FV and the weight-velocity relationship (in this case weight it is determined by multiplying each of the absolute loads by the standard acceleration due to gravity or 9.81 m.s-1). Conclusively, the MVT 1RM prediction method has been demonstrated to be the most valid and reliable of the three aforementioned methods (2).
Individual Linear Regression Equations vs Group Linear Regression Equations
It should come as no surprise that individual linear regression equations are more accurate at predicting 1RM than group linear regression equations (3), since it has been well established that the relationship between load and velocity must be individualized (4). I don’t see the purpose of investigating group linear regression equations, nor do I see the efficacy of group linear regression equations in group settings. In group settings, even if multiple athletes are using the same VBT device, each individual athlete can still have their individual linear regression equation (which is contingent upon the session; since the equation will of course change each session depending on the exact load and exact corresponding velocity). Of course, use your own individualized load-velocity profile; don’t use a generic group load-velocity profile.
Maximal Intended Velocity vs No Maximal Intended Velocity
I think a major limitation with the majority of the studies is that a maximal intended velocity cue is almost never provided. However, in one study in which there was a condition receiving a maximal intended velocity cue and a control condition (no maximal intended velocity cue was received), 1RM prediction was slightly more accurate in the condition receiving a maximal intended velocity cue (absolute errors: 3.1 ± 2.3 vs 4.1 ± 1.9 kg) (5). Again, logically this should come as no surprise, because if a subject isn’t provided with a cue to lift every repetition with maximal intended velocity, certain reps may be faster than normal and certain reps may be slower than normal. Consequently, this will have drastic changes to the slope of the regression line; thus, influencing the predicted 1RM.
Experienced vs Inexperienced Lifters
Interestingly, Banyard et al. (2017) reported higher training statuses (subjects able to free-weight back squat 1.5x body mass) had more accurate 1RM predictions than those of lower training statuses (6). The authors did not provide any discussion or interpretation to explain these findings. I’m not entirely sure why this is the case as I’ve witnessed mixed results with those of “higher training statuses”. To speculate, it may be because “higher training statuses” can “grind” (i.e. perform reps at slower velocities); however, since the individualized linear regression equation takes into account an individual’s 1RM ACV this doesn’t explain the entire picture.
Free-Weight Exercises vs Machine-Based Exercises
Finally, we get to free-weight vs machine-based exercises. This is where the differences in the findings really start to come into play. For the most part, linear regression equations involving free-weight exercises are not valid (6, 7) nor reliable (6), and typically over-estimate the actual 1RM by a significant magnitude (6, 7). However, for the most part, linear regression equations involving machine-based exercises are typically reasonably valid and reliable for 1RM prediction (5, 8). I’m not entirely sure why machine-based exercises are typically more accurate, but to speculate I think it may be because free-weight exercises are more prone to technical deviations; thus, the distinct path of the barbell may play a role.
High Percentage of 1RM vs Low Percentage of 1RM
Linear regression equations that use a higher percentage of 1RM (~80% of 1RM) are more accurate than those that use a lower percentage of 1RM (~60% of 1RM), regardless of the number of data points involved in the linear regression equation (6, 7). Therefore, it appears that the relationship between load and velocity becomes curved (rather than linear) as the load on the bar increases. In my opinion, the load-velocity relationship more closely resembles a 2nd order polynomial regression equation rather than a linear regression equation.
Individualized Linear Regression Equations vs Individualized Polynomial Regression Equations
I would cautiously make the argument that polynomial regression equations may be more accurate than linear regression equations at predicting 1RM (9), but unfortunately there is very limited research on their efficacy. I’m actually surprised that this is the case, since the most time- consuming component of running a study is typically the data collection. In other words, the researchers already have the data, so it’s just a matter of running the statistics, reporting the results, and integrating the results into the discussion section of the paper. In fact, the most recent paper on autoregulated load prescription did use an interesting method to prescribe load using a polynomial regression equation (10).

Conclusion
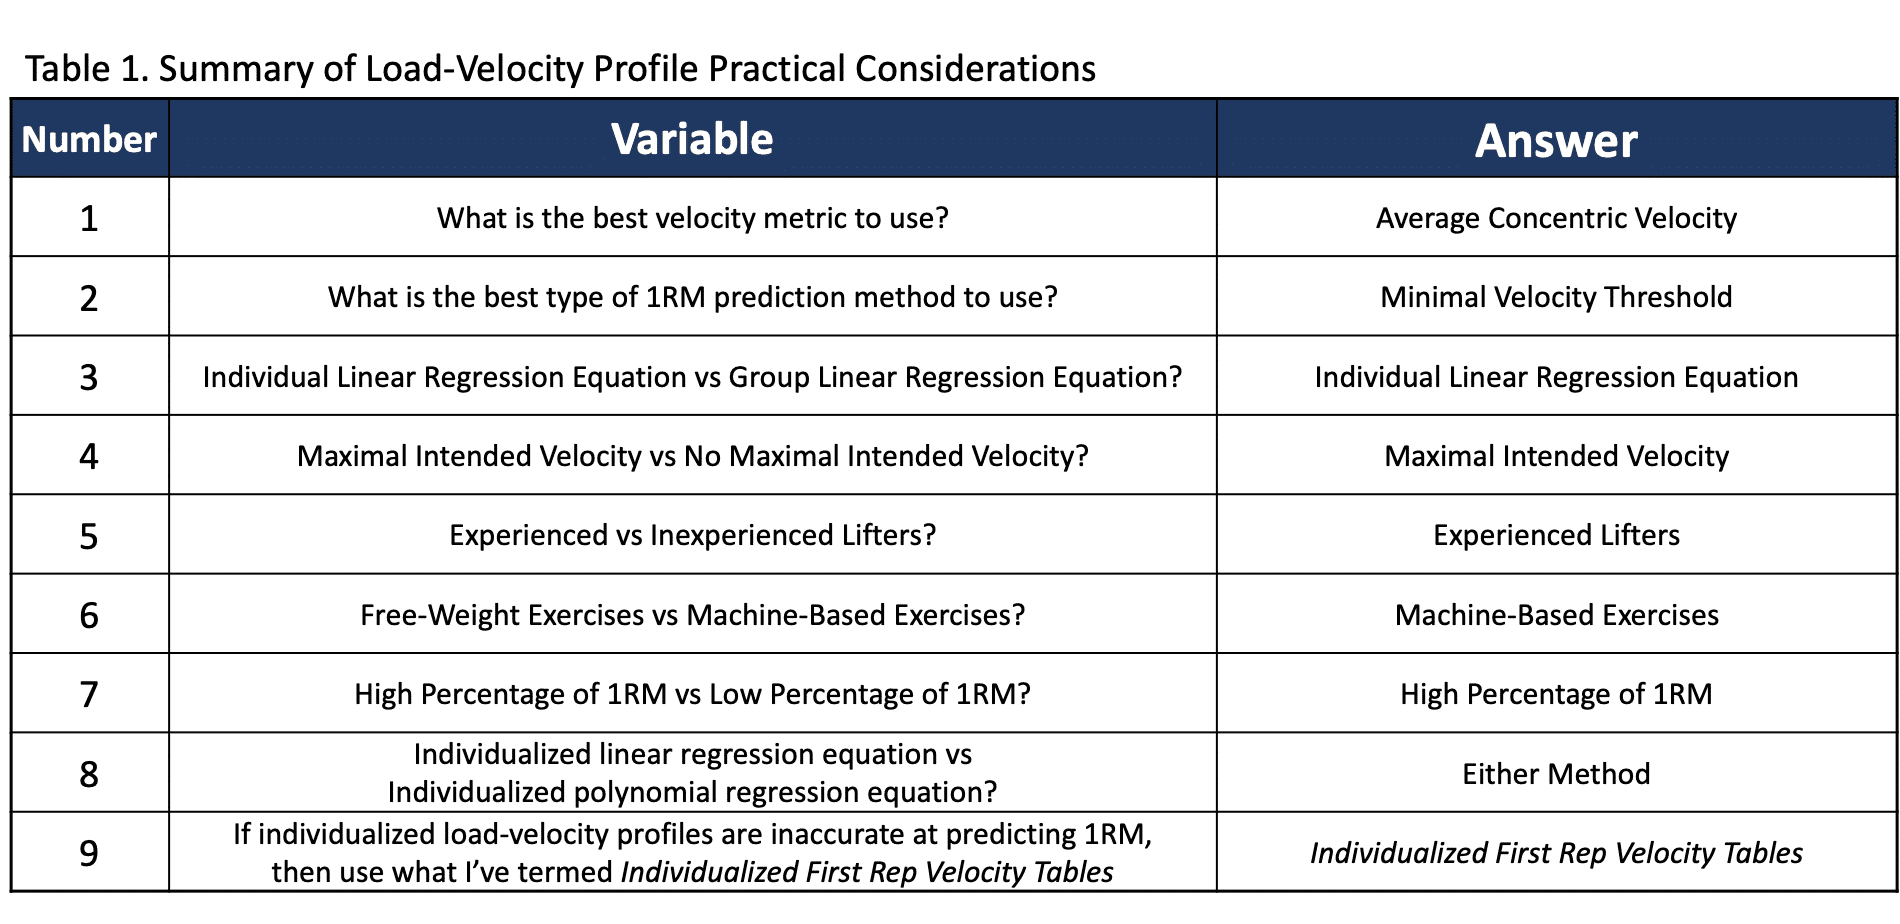
To summarize, if you are interested in giving regression equations a go, you should use an individualized equation (try both linear and polynomial), ACV as the velocity metric, MVT as the prediction method, a maximal intended velocity cue, and a high percentage of 1RM. Furthermore, prediction may be more accurate if you are of a higher training status and are using it for a machine-based exercise (which is probably rarely the case). A summary of the practical considerations is illustrated in table 1.
But a final question may be, “In the literature, how accurate are load-velocity profiles at predicting 1RM?” Some are nearly perfect (5, 8), whereas some over-predict 1RM by up to ~ 25 kilos (6, 7), but it is largely inter-individually variable. Nonetheless, the good news is that velocity is reliable at each percentage of 1RM (11). Therefore, I typically suggest using what I’ve termed an Individualized First Rep Velocity Table and cross-referencing velocity with percentage of 1RM. As a final note, I personally think that 1RM prediction is more useful as a tool to monitor 1RM over time rather than as an actual method to prescribe THE ENTIRE session from, simply because other autoregulation strategies can appropriately prescribe and autoregulate load and volume. The next paper will address methods of 1RM prediction and monitoring that I’ve found to be effective using the Individualized First Rep Velocity Table that I’ve created.
Key Takeaways
- Application considerations for load-velocity profiles include using an individual equation, average concentric velocity, minimal velocity threshold, maximal intended velocity, and a high percentage of 1RM
- Employ individualized linear regression equations or individualized second order polynomial equations only if they are consistently accurate at predicting 1RM for you
- Employ what I’ve termed an Individualized First Rep Velocity Table in order to cross-reference the individualized first rep velocity with the individualized percentage of 1RM as a quick and easy method to accurately determine the percentage of 1RM on the bar and predict 1RM
References
- Garcia-Ramos, A, Pestana-Melero, FL, Perez-Castilla, A, Rojas, FJ, and Haff, GG. Mean velocity vs. mean propulsive velocity vs. peak velocity: which variable determines bench press relative load with higher reliability. The Journal of Strength and Conditioning Research 32(5), 1273 – 1279, 2018.
- Hughes, LJ, Banyard HG, Dempsey, AR, and Scott, BR. Using a load-velocity relationship to predict one repetition maximum in free-weight exercise: a comparison of the different methods. The Journal of Strength and Conditioning Research 33(9), 2409 – 2419, 2019.
- Benavides-Ubric, A, Diez-Fernandez, DM, Rodriguez-Perez, MA, Ortega-Becerra, M, and Pareja-Blanco, F. Analysis of the load-velocity relationship in deadlift exercise. Journal of Sports Science and Medicine 19, 452 – 459, 2020.
- Helms, ER, Storey, AG, Cross, MR, Brown, SR, Lenetsky, S, Ramsay, H, Dillen, C, and Zourdos, MC. RPE and velocity relationships for the back squat, bench press, and deadlift in powerlifters. The Journal of Strength and Conditioning Research 31(2): 292 – 297, 2017.
- Jimenez-Alonso, A, Garcia-Ramos, A, Cepero, M, Miras-Moreno, S, Rojas, FJ, and Perez-Castilla. Velocity performance feedback during the free-weight bench press testing procedure: an effective strategy to increase the reliability and one repetition maximum accuracy prediction. The Journal of Strength and Conditioning Research [Epub ahead of print], 2020.
- Banyard, HG, Nosaka, K, and Haff, GG. Reliability and validity of the load-velocity relationship to predict the 1RM back squat. The Journal of Strength and Conditioning Research 31(7), 1897 – 1904, 2017.
- Ruf, L, Chery, C, and Taylor K. Validity and reliability of the load-velocity relationship to predict the one-repetition maximum in deadlift. The Journal of Strength and Conditioning Research 32(3), 681 – 689, 2018.
- Perez-Castilla, A, Suzovic, D, Domanovic, A, Fernandes, JFT, and Garcia-Ramos, A. Validity of different velocity-based methods and repetitions-to-failure equations for predicting the 1 repetition maximum during 2 upper-body pulling exercises. The Journal of Strength and Conditioning Research [Epub ahead of print], 2019.
- Pestana-Melero, FL, Haff, GG, Rojas, FJ, Perez-Castilla, A, and Garcia-Ramos, A. Reliability of the load-velocity relationship obtained through linear and polynomial regression models to predict the 1-repetition maximum load. Journal of Applied Biomechanics 34(3), 184 – 190.
- Dorrell, HF, Moore, JM, and Gee, TI. Comparison of individual and group-based load-velocity profiling as a means to dictate training load over a 6-week strength and power intervention. Journal of Sports Sciences [Epub ahead of print].
- Banyard, HG, Nosaka, K, Vernon, AD, and Haff, GG. The reliability of individualized load-velocity profiles. International Journal of Sports Physiology and Performance 13(6), 763 – 769.