22 de August de 2024
Decoding the Velocity-Load Curve: A Key to Effective Velocity-Based Training
In the world of Velocity-Based Training (VBT), understanding the Load-Velocity Curve is crucial. This curve provides insights into an athlete’s performance by illustrating the relationship between the speed of movement and the weight lifted. In this blog, we’ll delve into the Velocity-Load Curve, exploring how it can be used to assess and optimize training programs.

What is the Velocity-Load Curve?
The Velocity-Load Curve represents the relationship between the velocity at which an athlete lifts a load and the percentage of their one-repetition maximum (1RM). As the load increases, the velocity typically decreases, creating a curve that can be analyzed to understand an athlete’s strengths and weaknesses.
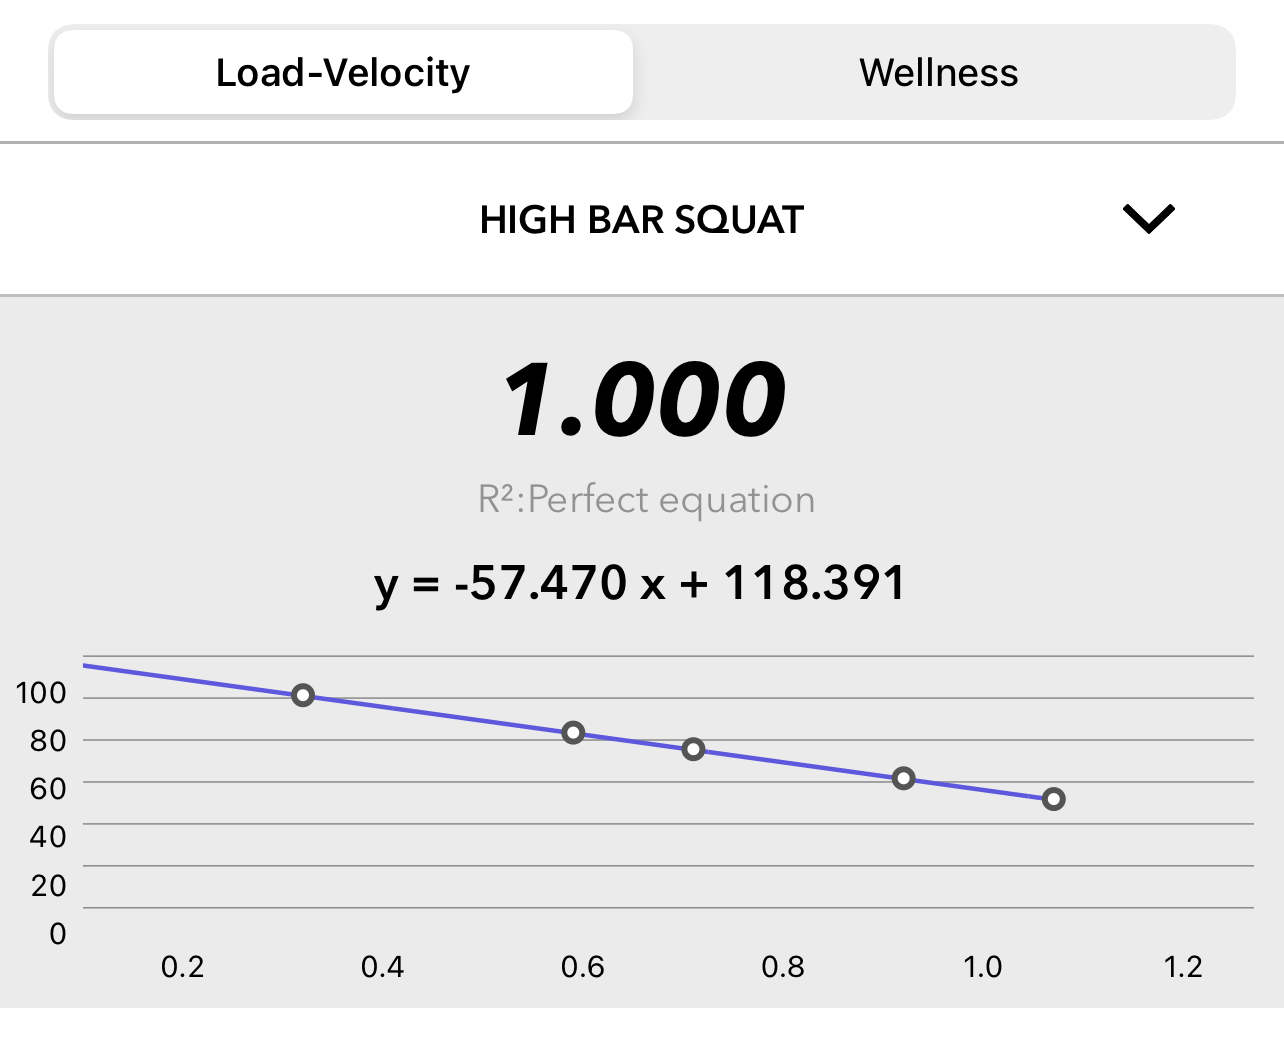
Image 1. Vitruve´s App Force-Velocity individual relationship profile
How to Interpret the Curve
- Heavy Loads and Low Velocity: The left side of the curve represents high weights lifted at low velocities. This area is crucial for developing maximum strength.
- Moderate Loads and Moderate Velocity: The middle section of the curve is ideal for building both strength and power, as it balances load and speed.
- Light Loads and High Velocity: The right side of the curve focuses on lighter loads lifted at higher speeds, which is essential for improving speed and explosiveness.
It is important to understand the nuance of this previous evaluation. We recommend you check out this webinar where we discuss the Load-Velocity relationship and its application in training and periodization.
Practical Applications of the Velocity-Load Curve
By analyzing the Velocity-Load Curve, coaches can identify the optimal training zones for each athlete. For example, an athlete who excels in lifting heavy loads but struggles with speed might benefit from training at higher velocities to improve their explosiveness. Conversely, an athlete with great speed but lacking in strength can focus on the left side of the curve to build more power.
The curve also allows for monitoring progress over time. By regularly assessing the curve, coaches can track improvements in both velocity and load, making it easier to adjust training plans accordingly.
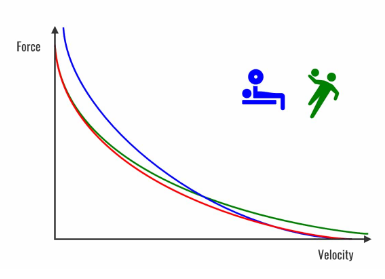
Image 2. Theorization of how certain types of training might affect the Force-Velocity curve.
The Velocity-Load Curve is a powerful tool in Velocity-Based Training, offering valuable insights into an athlete’s performance. By understanding and leveraging this curve, coaches can create more effective and personalized training programs.