6 de January de 2021
Ballistic push off F-V profile
Performance improvement in vertical jumping is largely related to performance in many sports. Throughout this article I will try to explain in a theoretical way what mechanical capabilities affect vertical jumping first hand and how to perform it in a practical way. So, let’s start.
What are the most important mechanical abilities when measuring performance in a vertical jump?
The ability to accelerate the body from a given position is a key factor in sports performance. This ability is closely related to the mechanical capabilities of the skeletal muscle and notably by the maximum power (Pmax). According to Newton’s second law, the acceleration of a body during the take-off phase depends on the resulting impulse. The impulse is not a mechanical capacity of the neuromuscular system. In fact, the mechanical capacity which could most condition this impulse is the Pmax, which is why many trainers have focused so much on developing it. Knowing how these mechanical characteristics work is key to improving performance.
We can understand power as the amount of work done per unit of time. In other words, the more work done in less time, the more power. Therefore, the ability to develop great power comes from the ability to develop great force at high speeds and great force at low speeds. These capacities have been well described by the Force-Speed and Power-Speed ratios. These ratios make it possible to describe very well the changes in the generation of force and power with increasing speed. Consequently two athletes with the same maximum power could have very different characteristics in the F-V profile.
The question here is… is it necessary to become stronger or faster to achieve maximum performance in ballistic movements? Well, according to Samozino et al (2) there is an optimal relationship between strength and speed for these, and it is determined by different individual characteristics such as body weight or length of body members. The F-V profile does not affect performance when expressed in absolute terms, but this is not the case when it is expressed as a relative value to load (body weight and extra loads if any).
According to Samozino et al (3) An optimal Force-Velocity (Sfvopt) profile in relation to force and speed is a function of the Pmax expressed relative to a mass. Therefore, the optimum force-velocity relationship will not be the same for a javelin thrower (large Pmax relative to the low mass it moves) as for a shot put thrower (low Pmax relative to the mass it moves) (2)
For the same Pmax, the Force-Speed ratios can be different affecting the vertical jump performance.
Samozino et al (3) observe that 10% increases in force improved vertical jump performance by 15% while 10% increases in speed improved vertical jump performance by 6 and 11%. Therefore, generating increases in the strength levels of your athletes is a clear necessity when improving this technical gesture. This is demonstrated in another study by Samozino et al (2) as the subjects tested in vertical jumping had an unfavourable average towards speed capabilities (from 36% to 104%FVimb) and those tested in horizontal jump showed an unfavourable average balance towards force capacities (from 66% to 270% FVimb)
However, you won’t get anywhere if you are dedicated to increasing your strength without practicing your own sportsmanship. You won’t improve your vertical jump without jumping. A large accumulation of jump volume is necessary over time to be able to perform efficiently.
- GOOD STRENGTH LEVELS
- GREAT EXPERIENCE OF VERTICAL JUMPING
Stimulate, your own body will reorganize itself in such a way that it will find the most efficient way to perform this gesture. Simply get your sportsman or woman to jump high or run fast and he or she will find the right technique.
THE TECHNIQUE DID NOT CREATE THE ATHLETE, THE ATHLETE CREATED THE TECHNIQUE
However, although the application of force will always be vertical it will influence the performance of a vertical jump and a sprint differently. Let us remember that during the acceleration phase in the jump the vertical net forces are lower and the horizontal net forces (braking forces generated by contact with the ground and not by gravity) are higher. Therefore, we must understand that the F0 presented in this profile belongs to the vertical vector (VTC-F0).
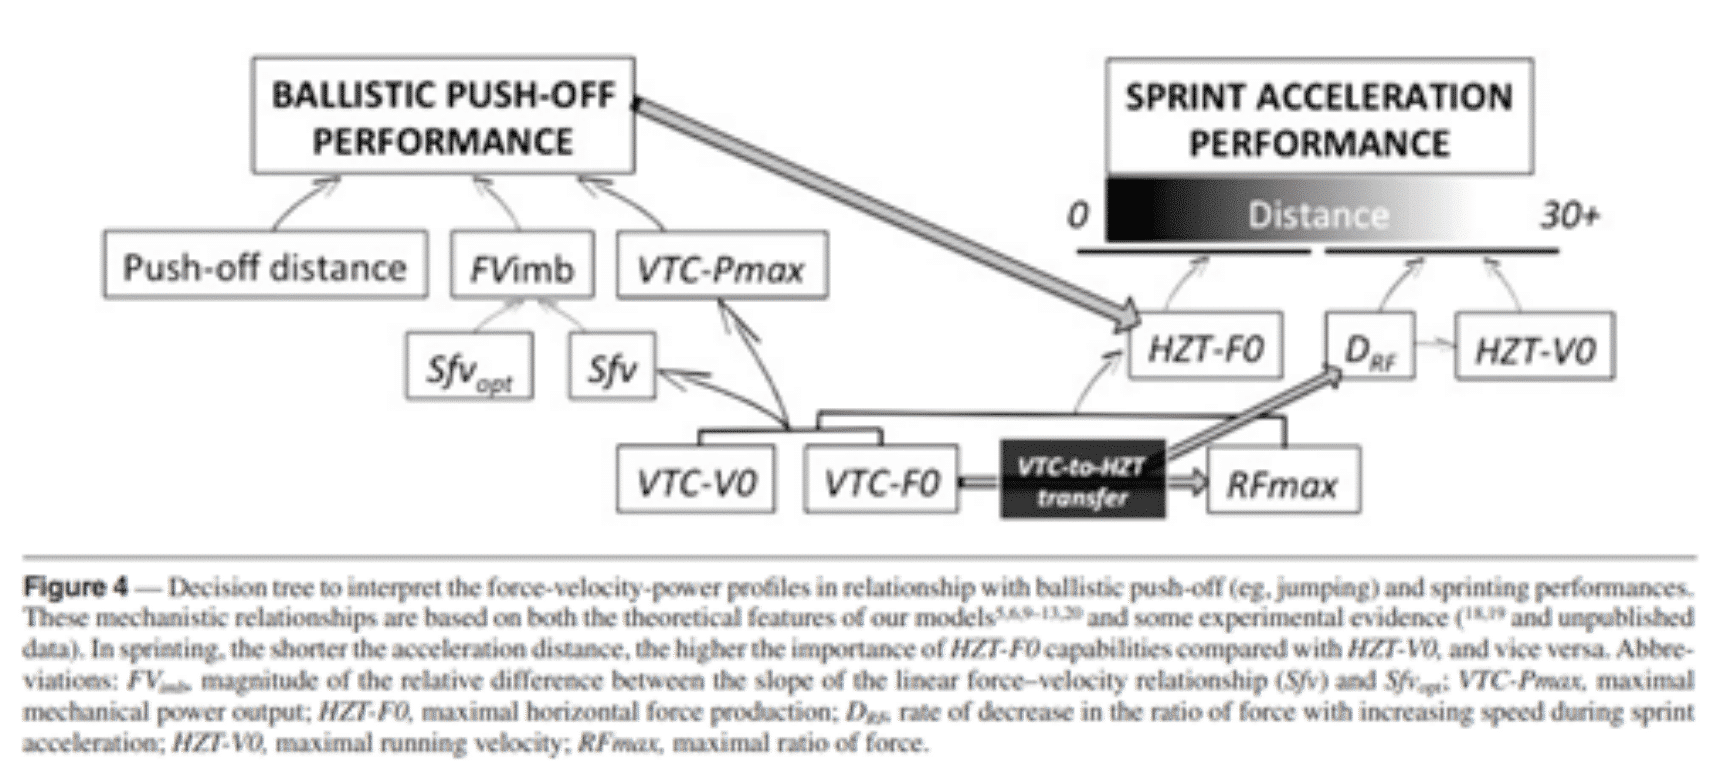
Figure 1. Decision tree to interpret Force-Velocity profiles in sprint in relation to the performance of vertical ballistic actions.
How do we measure these capabilities?
Regardless of the test we perform, the power will always be the result of force and speed.
If power = Work / Time
And work = Force x distance
We have that power = Force x Distance / Time
The quotient of the distance between the time is equal to the speed
So we can finally conclude that Power = Force x Speed
The squat jump can be a fully valid test for the measurement of these characteristics because it is a short duration and high explosive test. Counter movement or CMJ jump can alter the results due to neural and muscle-tendon factors, giving more reliable results the Squat Jump. This occurs due to an isolation of the mechanical capabilities as there is no shortening stretch cycle as in the CMJ. Even so, its results (height achieved), by themselves, cannot explain well the performance as there is a relationship between power, body weight and jumping height.
According to Samozino et al (3) the maximum height of two different sportsmen with different body weights will result in different maximum powers. The height of the subject can also lead to differences in maximum power, as athletes with the same body weight and jumping height, but with different heights, will generate different maximum powers. Do you remember the formula in the workbook attached above? The work depends on the distance covered and the power produced at that distance. Even if the same joint angles are established, the distance will still be different, and so will the speed. Therefore, push off distance and body weight must be taken into account.
Samozino et al describe the most important variables in vertical jump performance in this way
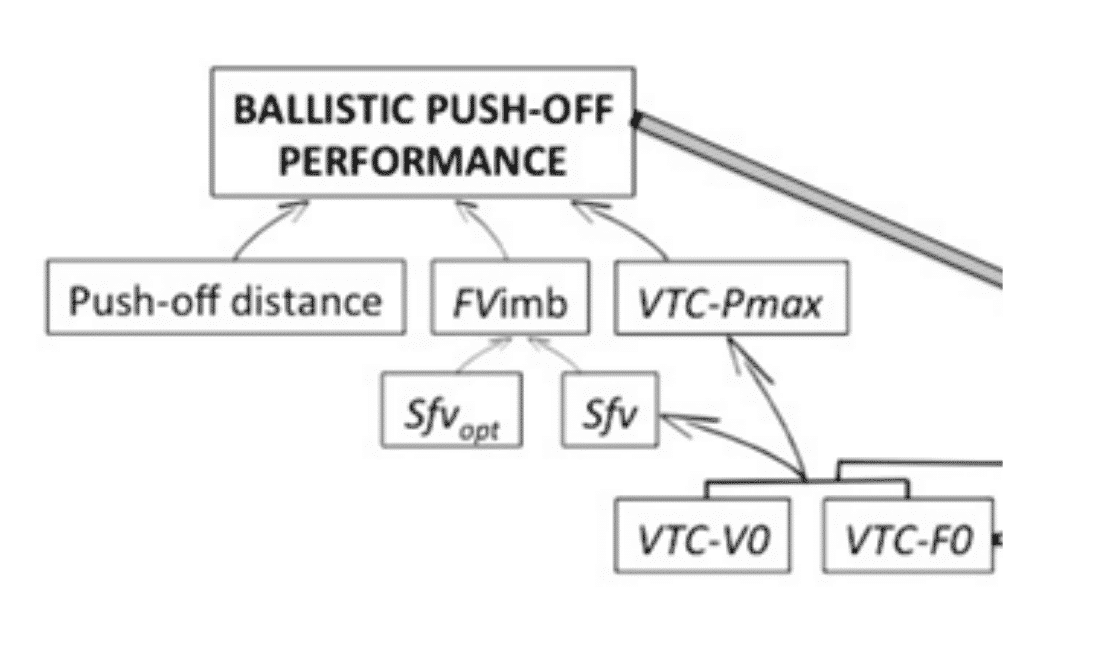
Figure 2. Variables affecting the performance of vertical ballistic actions
– Maximum mechanical power
– Magnitude between the difference between the slope of the F-V of the athlete and the optimal F-V slope for that athlete (in the optimal slope it is a function of the take-off distance and the body weight)
– Take-off distance
How can you understand and analyse these variables?
In this section I am going to explain more in depth the variables that affect the Force-Speed profile so that you can understand them and compare profiles of different sportsmen.
– Push-off distance: This is the distance that the athlete covers from the moment he starts to move until he takes off from the ground.
– Force-Velocity Imbalance (FVimb): This is the difference between the optimal Force-Speed ratio (Sfvopt) and the athlete’s Force-Speed ratio (Sfv) and is expressed as a percentage.
– If FVimb is equal to 100, the profile is optimised.
– If FVimb is above 100, the athlete has a speed deficit.
– If FVimb is below 100, the athlete has a strength deficit.
– Optimal Force-Velocity Slope (Sfvopt)
– Force-Velocity Slope (Sfv) Ratio of the athlete in the Force-Speed: The greater the difference with the Sfvopt the lower the performance for the same Pmax. In fact, the performance can vary up to 30% with high differences and same Pmax.
– Maximal Vertical Power (VTC-Pmax) Maximum Vertical Power
– Maximal Theoretical Vertical Velocity (VCT-V0)
– Maximum Theoretical Vertical Force (VTC-F0)
Samozino et al (4) explain how to analyse different profiles based on the above parameters
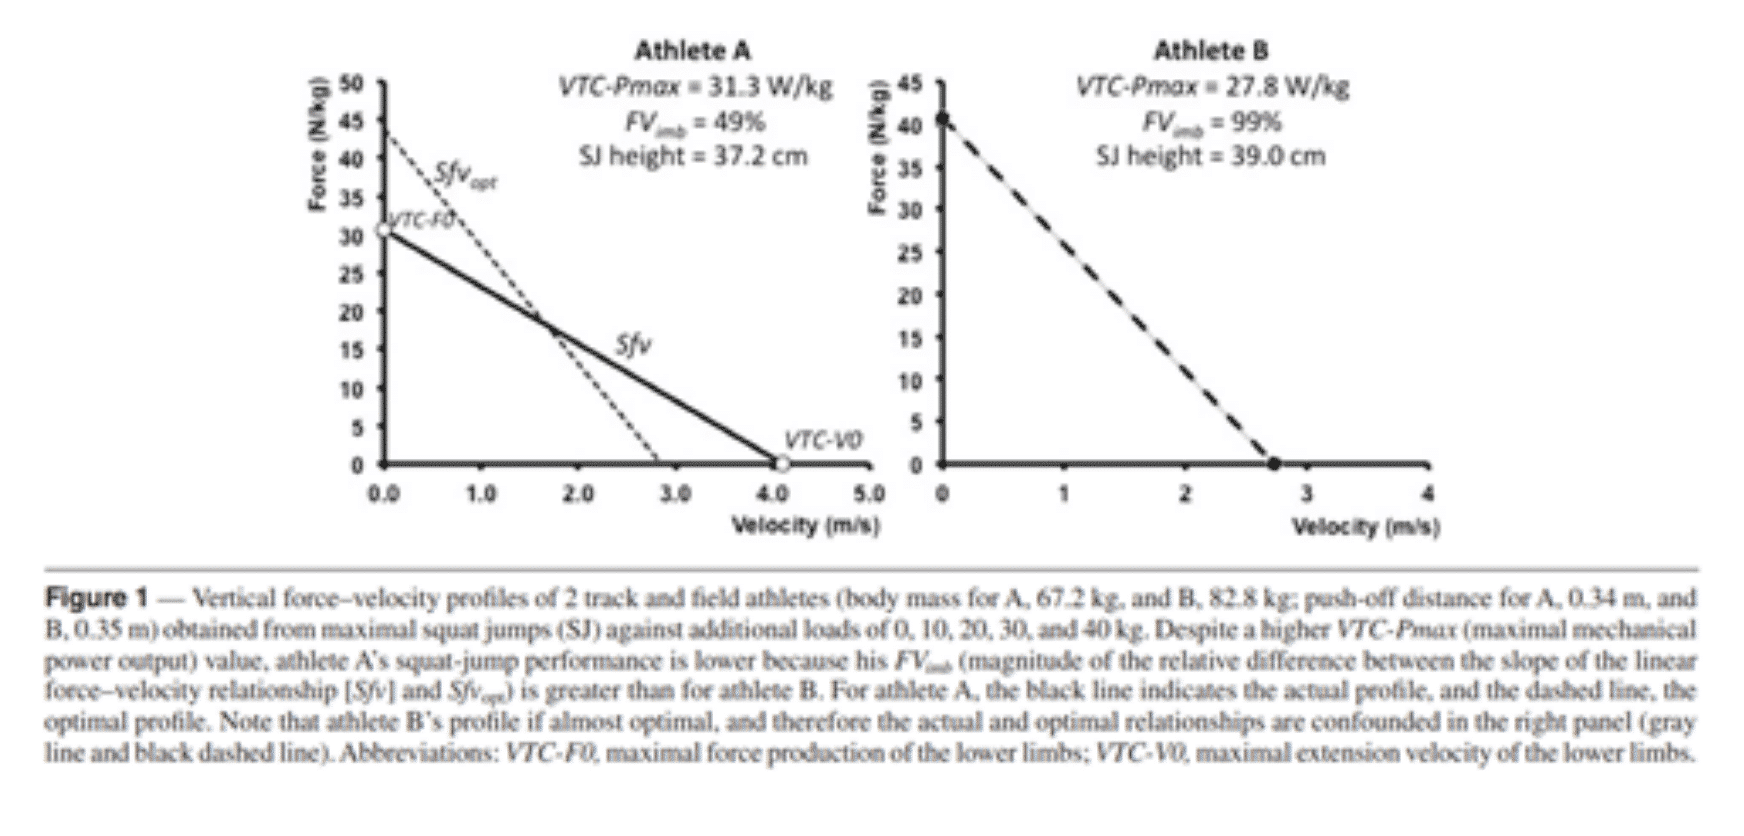
Figure 3. Comparison of 2 Strength-Speed profiles of two athletes with different characteristics
The athlete A weighs 67.2 kg and generates a maximum vertical power (VTC-Pmax) of 31.3 W/Kg
The B athlete weighs 82.8 and generates a maximum vertical power of 27.8 W/Kg
Although athlete A has a higher Pmax, his performance is lower than that of athlete B. This could be explained by a higher magnitude in FVimb (51% strength deficit) of athlete A . Athlete B shows an almost perfect F-V ratio (1% strength deficit).
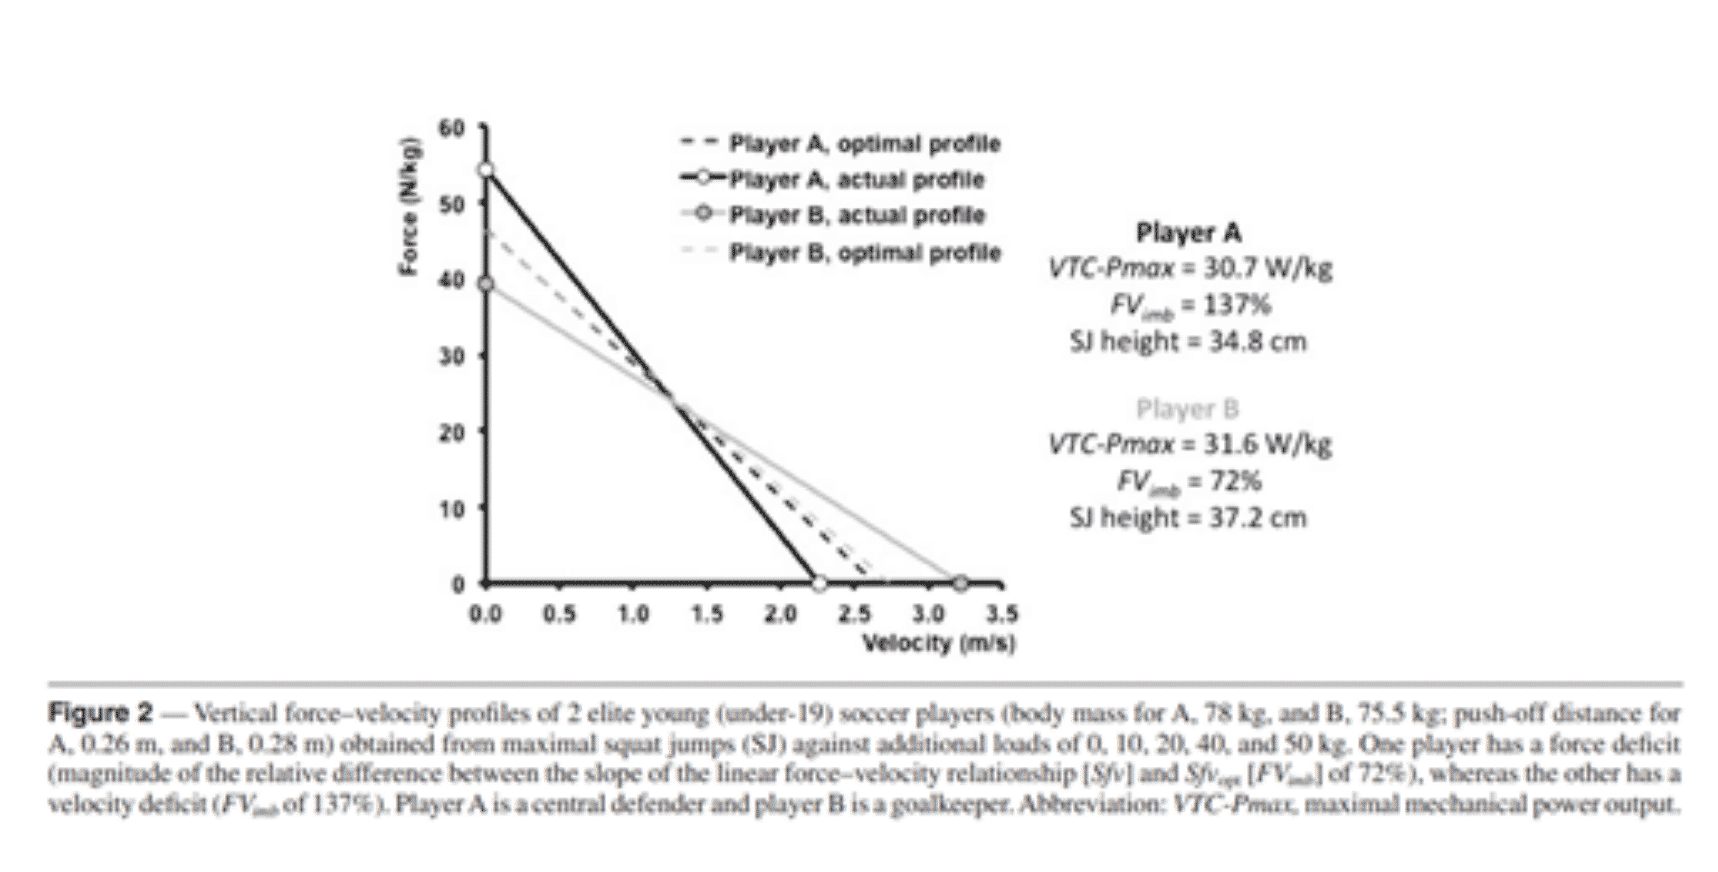
Figure 4. Comparison of two strength-velocity profiles of two athletes with different characteristics
The A athlete weighs 78 kg and has a maximum vertical power of 30.7 W/Kg
The B athlete weighs 75.5 kg and has a maximum vertical power of 31.6 W/Kg
While athlete A jumps 34.8 cm, athlete B jumps 37.2 cm. If you look at his FVimb you will notice that player A has an imbalance of 137% (37% speed deficit) and athlete B has another imbalance of 72% (28% strength deficit). Here you can see that if a lower FVimb is generated you can perform even better when that imbalance is given due to a strength deficit. Remember that force is a more relevant mechanical capacity than speed for improving vertical jump.
Where can I find the resources to perform this test?
We can obtain it, through the blog of a great researcher on the subject of profiles such as Jean Benoit Morín in which he provides us with an Excel sheet where we will introduce the necessary data. It is a free and very complete option.
http://jbmorinsportscience.blogspot.com/2017/10/a-spreadsheet-for-jump-force-velocity.htm
The steps to carry out the test correctly are indicated in the explanatory video provided by Morin in his blog.
Measuring the sport performance with vitruve
Performing SJ with a hexagonal bar is one of the best options you can follow to trace this gesture. You can do it also with a bar. Just make sure you measure the Hi and Hpo
– Hi: Starting height or distance from the ground to the iliac crest when the athlete is in the starting position.
– Hpo: Take-off height or distance from the ground to the crest of the body when the athlete is at the end of the jump
– H: Height of jump and in our case it will be the difference between Hpo and the total ROM provided by vitruve.
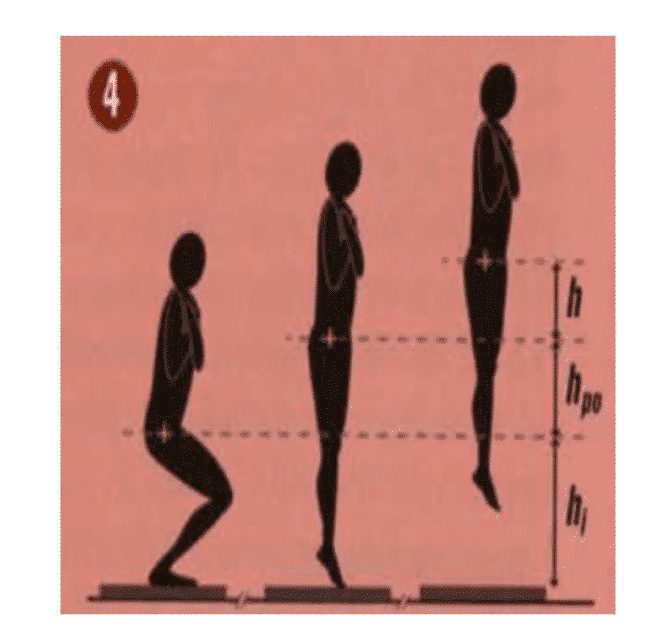
– Description of the measures that are necessary to calculate the F-V profile
– To correctly measure the Hi when you perform the test with vitruve, simply subtract the height from when you anchor the encoder to the bar to the ground.

To measure the Hpo, simply drop your sportsman and place him fully extended at the ankle. To measure this correctly, subtract the height from the point where you anchor the encoder to the ground. Measuring the Hpo with the sportsman lying on the ground with his ankles extended.
Once you have subtracted these you can enter them into the excel spreadsheet as they will be reliable and real data.
Here’s a practical example to help you understand it better:
– My athlete has a 45 cm Hi and 97 cm Hpo
– The height from which I anchor the encoder is 22.5 (the encoder will provide me with data from that height so we will take it as the 0 cm)
– The total ROM is 137 cm
– Subtract this height from the Hi and Hpo
– Hi: 45 – 22.5 = 22.5 (theoretical height for measurement with vitruve)
– Hpo: 97 – 22.5 = 74.5 (Theoretical height for measurement with vitruve)
Finally to calculate H, you will only have to subtract Hpo from the total ROM provided by the survey.
H: 137 (total ROM) – 74.5 = 62.5 cm vertical jump
Enter all this data into the spreadsheet provided by JB Morín and you will have the F-V profile available with all the data that will allow you to obtain a conclusion before setting out the next training block. If you have any questions, don’t hesitate to ask! Leave a comment or contact us here.
References
- Samozino P, Morin JB, Et Al. A simple method for measuring force, velocity and power output during squat jump. Journal of Biomechanics 41 (2008) 2940–2945
- Samozino P, Rejc E, EtAl. Optimal Force-Velocity Profile in Ballistic Movements—Altius: Citius or Fortius?. Med Sci Sports Exerc. 2012 Feb;44(2):313-22. doi: 10.1249/MSS.0b013e31822d757a.
- Samozino P, JB Morín, Rejc E, Enrico Di Prampero, Belli A. Optimal Force–Velocity Profile in Ballistic Movements—Altius. July 2011 Medicine and science in sports and exercise 44(2):313-22 DOI: 10.1249/MSS.0b013e31822d757a
- Samozino P, Morín JB. Interpreting Power-Force-Velocity Profiles for Individualized and Specific Training. December 2015. International Journal of Sports Physiology and Performance 11(2) DOI: 10.1123/ijspp.2015-0638

