22 de June de 2020
Velocity Loss and Fatigue
Monitoring and managing training load, both acute and during longer time frames, is one of the cornerstones of performance-enhancing strategies implementation. Regardless of the method or model implemented, every single one of them are built just for one purpose: Manipulating FATIGUE.
Every coach on the planet knows how imperative is to monitor and manage fatigue not only for improving performance in general but also for reducing injury risk, avoiding inhibition of proper adaptation and reaching peak performance at specific moments such as important matches or competitions.
Actually, every training program is in fact by definition managing fatigue. Even though it has been widespread the concept of managing training loads, this is quite biased given that fatigue and not load is the limiting factor and the rationale behind every single periodization scheme: Lienal, undulating, blocks, you name it!.
There are several techniques that can be used in order to examine fatigue from training and competing in sport through different subjective (e.g. RPE) or objective (e.g. power output) measures.
But, what fatigue actually is?, Well…let´s try to figure that out…
Fatigue
Fatigue has been an issue for sports coaches and trainers since the very beginning. We can trace the back and forth influences of sport and military to ancient Greece. More modern attempts to understand the factors that determine fatigue and sports performance can be traced back to European studies that started in the late 19th century. An influential book written by the Italian physiologist A. Mosso, a professor of physiology at the University of Turin, was one of the first to consider the biological basis for fatigue that develops during exercise.
Mosso’s ideas did not gain immediate acceptance in the exercise sciences but remained silent until more recently rediscovered 1. Instead, they were supplanted after 1923 by a different and more simplistic interpretation promoted by the English Nobel Prize winner Archibald Vivian Hill. The studies that would become perhaps the most influential in the history of exercise science were conducted by Hill and his colleagues at University College London between 1923 and 19252.
Generally, fatigue is defined as a loss of force or power in response to contractile activity and can occur as a result of impairments or adaptations at a multitude of physiological locations34. Moreover, fatigue can be seen as an exercise-induced diminishment or impairment of performance 5. But every definition falls as a reductionistic approach of a more complex issue and our understanding of the aetiology and underlying mechanisms of fatigue during exercise is still under debate6.
This reduction in muscle capacity is limited by central and/or peripheral components. The Central components involve a failure in the CNS to recruit motor units, that is, a reduction in core motor drive and the peripheral components involve a biochemical change within the metabolic environment of the muscles, leading to an attenuated response to nerve excitation7.
The central and peripheral mechanisms have generally been studied in isolation, assuming that their combination occurs linearly, which has probably produced biases in the interpretation of the data and in the conclusions obtained. Abbiss and Laursen have carried out a complete review of these models, including the cardiovascular/anaerobic model, the energy supply/depletion model, the neuromuscular model, the muscle trauma model, the biomechanical model, the thermoregulation model and, finally, the motivational/psychological model, which focuses on the influence of intra psychological factors, such as performance expectations or the effort required7.
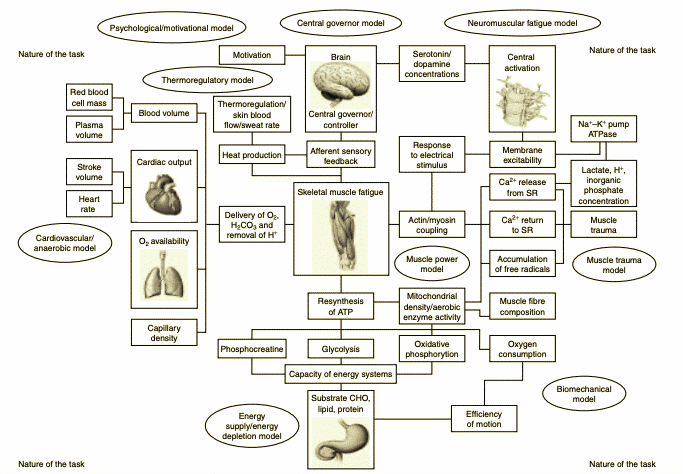 Figure 1 Models to Explain Fatigue 7
Additionally, Noakes has argued that fatigue is a sensory perception, rather than a physical phenomenon8. Also, compelling evidence exists for a complex, but centrally integrated model of fatigue with afferent feedback from the periphery, informing the perception of fatigue and resulting in an attenuation of work output, which may be consciously or unconsciously determined6.
Moreover, it has been proposed that there is an individual critical threshold of peripheral muscle fatigue, which is associated with a certain degree / sensory perception of afferent feedback. Notably, the exercise-induced intramuscular level of certain metabolites known to cause peripheral fatigue (eg, protons, phosphate, etc.) is very similar in exhaustion, regardless of the type of exercise and the individual rate of change of metabolic disturbance9.
In this way, the metabolic environment of the skeletal muscles that generate power to sustain a given effort, implies a certain afference to the central nervous system, which will determine the magnitude of the central motor impulse to continue recruiting a given number of motor units and thus be able to generate or not the required output during exercise9.
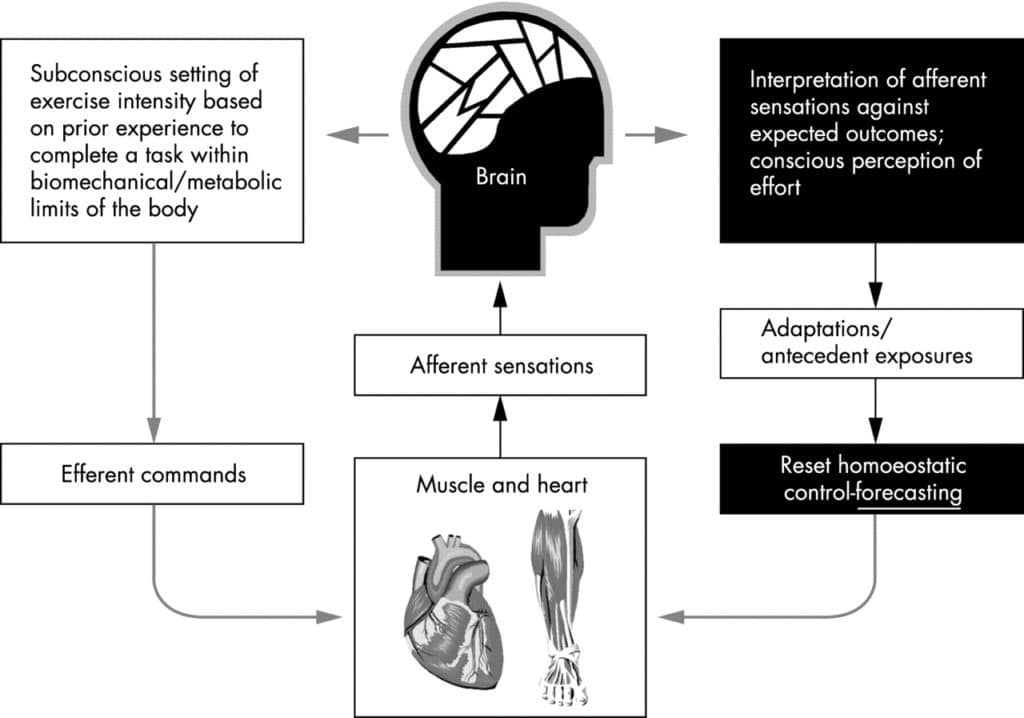
Figure 2 Relation between the teleoanticipatory governor centre in the brain and perceived exertion during exercise 6.
The best current working definition of fatigue is ‘any exercise or non-exercise-induced loss in performance due to various physiological factors, athlete reported psychological factors or a combination of the two
To fully understand the nature of skeletal muscle fatigue, different topics as diverse as neurophysiology, intracellular signalling, vascular function, bioenergetics, and molecular mechanics are mandatory and one must take into consideration the impact of external factors such as disuse and disease on the mechanisms of fatigue3.
Finally, even though there is no doubt about the relationship between fatigue and some objective measures, it has been suggested that fatigue is also affected by subjective perception, thus including an aspect of ‘subjectiveness’ into the definition of fatigue is mandatory10. Because of this, perhaps the best current working definition of fatigue is ‘any exercise or non-exercise-induced loss in performance due to various physiological factors, athlete reported psychological factors or a combination of the two11.
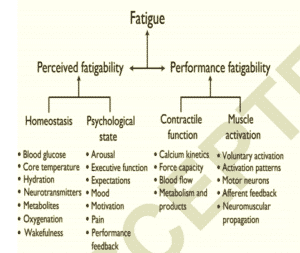 Figure 3 The proposed taxonomy suggests that fatigue be defined as a self-reported disabling symptom derived from two interdependent attributes: perceived fatigability and performance fatigability.12
In an attempt to provide a more unifying rubric, it is proposed that fatigue be defined as a symptom in which physical and cognitive function is limited by interactions between performance fatigability and perceived fatigability12.
Since, by definition, fatigue reduces athletic performance capabilities, many coaches have attempted to periodically measure the fatigue of their athletes so that they may adjust training protocols appropriately.
Measuring Fatigue
Because of the fact that training under high-levels of fatigue can blunt proper adaptation o even inhibit it, being able to monitor fatigue is crucial for any coach, trainer, or sports scientist. Additionally, having some insight about how “fresh” an athlete is may provide important information about the athlete capacity to tolerate training stress, sensitivity to adapt to that stress or even their ability to perform.
Analysing and understanding the dose-response relationship of an athlete training program is vital to maximize performance, avoid injuries and overtraining and a must for implementing any periodisation model.
Any stress on the body, including physical stress from training sessions, can be interpreted as a “dose”, the levels of fatigue associated with that dose could be seen as a “response” and the subsequent performances as the “outcome”. Therefore, collecting, analysing and understanding the dose-response relationship of an athlete training program is vital to maximize performance, avoid injuries and overtraining and a must for implementing any periodisation model.
Wrapping things up, the main advantage of designing and implementing a fatigue monitoring system is “estimating” how each trainee is responding to a given program and therefore adjusting as needed to guarantee adaptation, prevent overtraining, avoid injury and maximise performance.
Subjective Testing
The potential efficacy of subjective measures for athlete monitoring has been established by the literature. However, optimal implementation practices are yet to be determined. Implementation practices affect how well athlete well-being is reflected, and whether the data can be used in a meaningful way10.
In addition, subjective testing is easy, non-invasive, cheap and requires no equipment and can provide immediate feedback. On the other hand, consistency, familiarization and robust analysis of the data are crucial for increasing testing sensitivity.
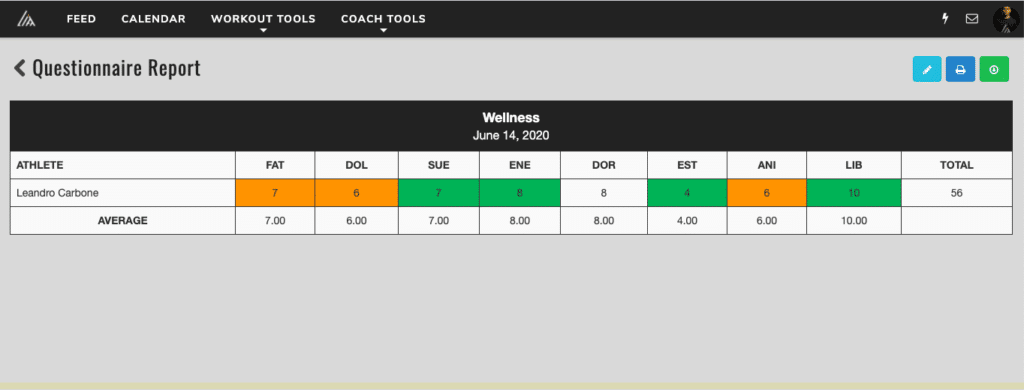
Wellness questionnaires are one of the most popular assessments for subjective well-being and referred to as athlete self-report measures. This is simply a questionnaire given to the athlete for them to rate how they feel. This will often include different topics such as sleep quality, non-training stress-level, body soreness, perception of tiredness13 but in practice, the structure and questions used are entirely dependant of the coach needs and athletes background.
However, it is important to understand that only some questionnaires have been scientifically validated and found to be sensitive to changes in weekly training regimens 10,14,15. Regardless, wellness questionnaires appear to work well as a fatigue monitoring tool, especially with large groups such as in team sport environments.
Figure 4 Example of a wellness questionnaire daily report. FAT=Fatigue level; DOL=Soreness level; SUE=Sleep quality; ENE= Energy Levels; DOR= Quantity of Sleeping Hours; EST= Stress Levels; ANI= General Well-Being; LIB= Libido Levels. Several Numeric Thresholds have been established and colour reflects Green=Good; Yellow=Normal; Red= Bad. Data were taken from a rugby player.
This is simply a questionnaire given to the athlete for them to rate how they feel. This will often include different topics such as sleep quality, non-training stress-level, body soreness, perception of tiredness
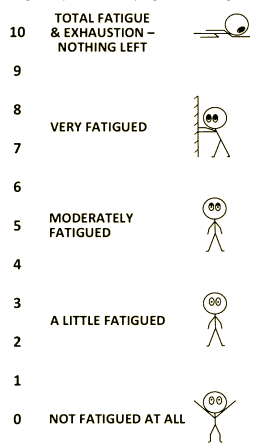
Rating of fatigue is another subjective tool to monitor fatigue. It has been proved to be valid and reliable11. This scale is designed to provide a holistic measure of how fatigued an individual feels and is done through the use of an 11-point scale. Rating of Fatigue scale appears to have a high-correlation with physiological fatigue markers, and also it seems to be capable of differentiating between perceived exertion during recovery and during exercise11.
Figure 5 Rating of Fatigue Scale proposed by Micklewright et al., 201711.
Finally, new technologies are emerging like facial coding which appears to be able to detect fatigue and mood changes with accuracy, but the science in practical application lags far behind yet.
Objective Measures
Objective measures to assess fatigue levels can be a bit tricky. First of all, whatever variable we select to use, it´s mandatory to be consistent on the protocol applied to collect the data. Also, it´s important to track and analyze it properly.
Nowadays, with the advances in the field of sports technology, it´s really easy to have access to some kinetic, kinematic or physiological devices and it will be the limiting factor to pick an objective tracking variable.
Most popular variables trend to be related to force production and protocols usually involve jumping. However, the possibilities are endless. If you can think of a maximal intended manifestation of neuromuscular power it would certainly qualify as a potential objective measure to assess fatigue. Jumps, Isometrics, Sub Max Squats, Throws, etc with the proper reliable and valid device and protocol, can be valid choices to measure fatigue.
I´m lucky enough to have a dual force plate, powerful enough to measure vertical force production and of course all the time dependant variables derivatives such as RFD, Time to Peak Force, Impulse, etc. Because most of the literature is based on jumping protocols to assess fatigue, I used to implement CMJ as well. But, CMJ and every other jump is too “technique” dependent. Don´t misunderstand me, I´m not saying is useless, in fact, I still collect data from different types of jumps. But lately, I’ve switched my readiness assessment from CMJ to isometric mid-thigh pull, and the reason is not entirely science-based but heuristic. I found that IMTP is easier to explain, implement, and perform by the athletes and maybe (can´t prove it) more sensitive to change.
So, the IMTP Requires an individual to pull on a fixed barbell with a maximal effort for 3-5 seconds. When performed on top of a force plate, the test can quantify peak force, relative force, RFD, time to peak force, etc.16.
 Figure 6 Dual Force Plate assessment of an IMTP. Data were taken from a rugby player.
I found that IMTP is easier to explain, implement, and perform by the athletes and maybe (can´t prove it) more sensitive to change.
Finally, other metrics can also be used such as blood or saliva markers and also physiological testing such as heart rate, heart rate variability, and other measures of physical state are common in sport. Physiological monitoring of fatigue can show up in readiness tests to the autonomic nervous system (ANS) or centrally to the higher centres of the body (CNS). Sleep monitoring with non-invasive methods has grown in popularity but still requires clinical evaluation to determine the severity of reported sleep impairment.
Velocity Loss
Commercially available devices like linear position transducer (LPT) are much more popular, transportable, cheaper and probably versatile than force plate. And even though we usually use them as training devices, their power for testing purposes are endless.
In fact, one of the most popular uses of LPT is in fact by definition related to monitoring fatigue. Every time we are tracking the velocity loss of a given set, we are trying to manage fatigue17.
As we mentioned before, objective measures of fatigue are usually, not solely, related to mechanical variables (mainly force). But velocity is linearly related to force, as the applied force increases the velocity manifested growth as well. And as fatigue arises, force and velocity output decline17.
One of the most popular uses of LPT is in fact by definition related to monitoring fatigue
In fact, research has shown that there is a high correlation between mechanical (velocity and countermovement jump height losses) and metabolic (lactate, ammonia) measures of fatigue which support the validity of using velocity loss to objectively quantify neuromuscular fatigue during resistance training and thus converting velocity loss in a powerful tool to lead adaptation17.
Moreover, the fastest velocity achieved with a constant sub max weight can be another useful mechanical variable to assess neuromuscular fatigue17,18.
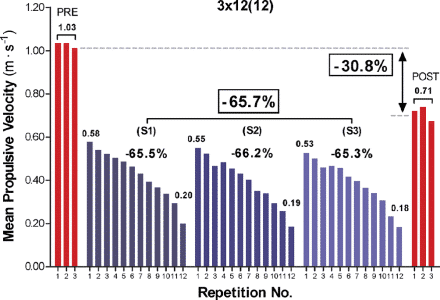 Figure 7 As velocity of given set declines, fatigue arises17.
Readiness
Finally, we´ve already addressed everything about fatigue measure variables, which of them exists, how to choose them and why. But, how to analyze it to properly know what is really going on???
The principle is that if the athlete scores in his or her tests are similar to those of his baseline then he is assumed to be ready to train according to the planned program. Training when not ready is problematic as we´ve already mentioned. But again, how we can know for sure ??
Monitoring fatigue requires an array of data types to properly identify the root cause of the fatigue and whether a change or adjustment is necessary. The essential requirements of monitoring and analyzing fatigue are the collection of quality information and the continuity of the data. Ones we determined which variable we are tracking then we need to establish what type of analysis we are going to perform.
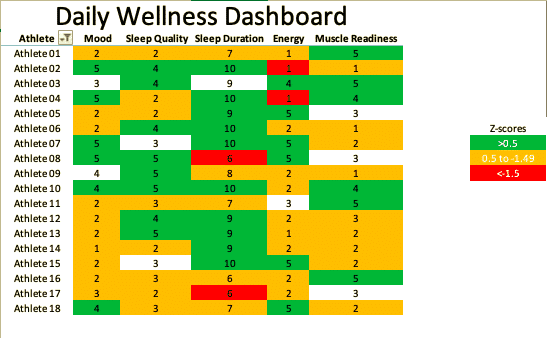
For example wellness questionnaire, as shown before, could be analyzed just with an arbitrary threshold (1-3 bad, 4-7 normal, 8-10 good) then relate those “zones” with colors and we are ready to go.
But things could get a little complicated if we want a deeper insight with more robust analysis. If we have a data frame long enough to build a baseline, it could be more sensitive analysis using it for comparison and setting our thresholds as variations (or Z score) across that baseline (see magnitude-based inference blog post for deeper understanding).
Figure 8 Wellnes report dashboard using Z-Scores for establishing readiness Zones.Data were taken from a rugby team.
Finally, sports scientist are investigating how to build models from this data with the use of neural networks and AI. It is still in the early stages but it looks really promising and if they succeed maybe we could have a tool powerful enough to even “predict” future events regarding performance, fatigue or injuries. Time will tell.
Bibliography
1.Giulio, C. D., Daniele, F. & Tipton, C. M. Angelo Mosso and muscular fatigue: 116 years after the first congress of physiologists: IUPS commemoration. Advances in Physiology Education 30, 51–57 (2006).
2.Hill, A. V. & Long, C. N. H. Muscular exercise, lactic acid, and the supply and utilisation of oxygen. Ergebnisse der Physiologie 24, 43–51 (1925).
3.Kent-Braun, J. A., Fitts, R. H. & Christie, A. Skeletal Muscle Fatigue. Comprehensive Physiology (2012). doi:10.1002/cphy.c110029
4.Edwards, R. H. T. Human Muscle Function and Fatigue. in Novartis Foundation Symposia 1–18 (John Wiley & Sons, Ltd., 2008). doi:10.1002/9780470715420.ch1
5.Knicker, A. J., Renshaw, I., Oldham, A. R. H. & Cairns, S. P. Interactive Processes Link the Multiple Symptoms of Fatigue in Sport Competition. Sports Medicine 41, 307–328 (2011).
6.Lambert, E. V. Complex systems model of fatigue: integrative homoeostatic control of peripheral physiological systems during exercise in humans. British Journal of Sports Medicine 39, 52–62 (2005).
7.Abbiss, C. R. & Laursen, P. B. Models to Explain Fatigue during Prolonged Endurance Cycling. Sports Medicine 35, 865–898 (2005).
8.St Clair Gibson, A. Evidence for complex system integration and dynamic neural regulation of skeletal muscle recruitment during exercise in humans. British Journal of Sports Medicine 38, 797–806 (2004).
9.AMANN, M. Central and Peripheral Fatigue. Medicine & Science in Sports & Exercise 43, 2039–2045 (2011).
10.Saw, A. E., Main, L. C. & Gastin, P. B. Monitoring the athlete training response: subjective self-reported measures trump commonly used objective measures: a systematic review. British Journal of Sports Medicine 50, 281–291 (2015).
11.Micklewright, D., St Clair Gibson, A., Gladwell, V. & Al Salman, A. Development and Validity of the Rating-of-Fatigue Scale. Sports Medicine 47, 2375–2393 (2017).
12.ENOKA, R. M. & DUCHATEAU, J. Translating Fatigue to Human Performance. Medicine & Science in Sports & Exercise 48, 2228–2238 (2016).
13.Rushall, B. S. A tool for measuring stress tolerance in elite athletes. Journal of Applied Sport Psychology 2, 51–66 (1990).
14.Gastin, P. B., Meyer, D. & Robinson, D. Perceptions of Wellness to Monitor Adaptive Responses to Training and Competition in Elite Australian Football. Journal of Strength and Conditioning Research 27, 2518–2526 (2013).
15.McGahan, J., O’ Neill, C. & Burns, C. Seasonal variation of training, competition load and markers of wellness in an elite Gaelic football team. Physical Therapy in Sport 28, e24 (2017).
16.De Witt, J. K. et al. Isometric Midthigh Pull Reliability and Relationship to Deadlift One Repetition Maximum. Journal of Strength and Conditioning Research 32, 528–533 (2018).
17.SÁNCHEZ-MEDINA, L. & GONZÁLEZ-BADILLO, J. J. Velocity Loss as an Indicator of Neuromuscular Fatigue during Resistance Training. Medicine & Science in Sports & Exercise 43, 1725–1734 (2011).
18.González-Badillo, J. J. & Sánchez-Medina, L. Movement Velocity as a Measure of Loading Intensity in Resistance Training. International Journal of Sports Medicine 31, 347–352 (2010).


