
Each method of load prescription is typically thought of as a separate practice; either you prescribe load as a percentage of 1RM, with RPE, or using velocity. Join me as I address how we can integrate all three load prescription methods by formulating first and last rep velocity tables in order to systematically individualize load prescription for each athlete.
Landyn Hickmott, MS(c), CSCS
Key Points
- An integrated model of load prescription can be proposed in order to rectify the limitations and highlight the advantages of PBT, RPE, and VBT
- First rep velocity tables can be formulated to integrate VBT with PBT, and last rep velocity tables can be formulated to integrate VBT with RPE
- First rep velocity tables can be applied to individualize load adjustments from set-to-set, and last rep velocity tables can be applied to individualize proximity from failure on each set
Introduction
How do you prescribe load? Percentage of 1RM? RPE? Velocity? I’ll state this: you should be integrating all three. Yes, that means percentage of 1RM as well! First, I’ll briefly discuss each of the three most commonly employed load prescription methods as standalone practices: percentage of 1RM (% of 1RM), repetitions in reserve-based rating of perceived exertion (RIR-based RPE), and velocity-based training (VBT). Next, I’ll dive into how to integrate these three methods of load prescription by providing step-by-step instruction for how you can formulate your own first and last rep velocity tables. Finally, I’ll walk-through four different practical examples on how you can directly apply first and last rep velocity tables in order to appropriately individualize load prescription.
Primary Methods of Load Prescription
Percentage-Based Load Prescription
Percentage-based training (PBT) is the most basic method of load prescription. PBT involves prescribing a certain number of reps to perform at a specific % of 1RM. For example, an athlete may be prescribed 3 sets of 4 reps at 85% of 1RM. Table 1 illustrates a reps allowed table, which corresponds the number of reps allowed on average for most individuals and most exercises to each % of 1RM (1).
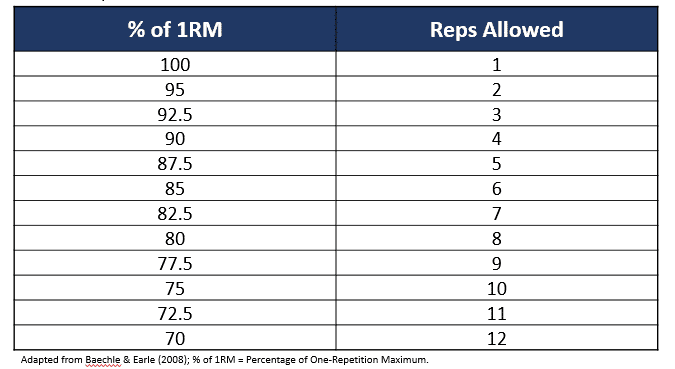 Table 1. Repetitions Allowed Table
Nonetheless, PBT poses several significant limitations. For instance, 1RM may fluctuate considerably from session-to-session and may change markedly over the course of a training cycle (2). Most notably, reps performed at given intensities is different between athletes and across lifts (3). Therefore, prescribing universal reps allowed tables to all athletes and for all lifts fails to account for the same proximity from failure between athletes and across lifts. Subsequently, this may cause unintended adaptations and unfavorable performance outcomes. For example, let’s say that athlete 1 and athlete 2 performed a set to failure on the squat at each % of 1RM from table 1 in order to develop their individualized reps allowed table (Table 2). Note the difference in the reps performed at each given % of 1RM between athlete 1 (performs a lower number of reps at most percentages of 1RM) and athlete 2 (can perform a higher number of reps at most percentages of 1RM).
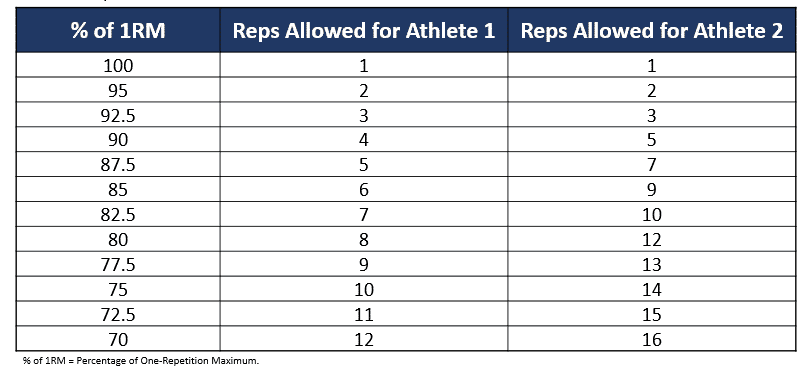 Table 2. Repetitions Allowed Table for Athlete 1 and Athlete 2
RPE-Based Load Prescription
In 2016, Zourdos and colleagues developed the RIR-based RPE scale in attempt to mitigate the limitations associated with PBT by standardizing the inter-individual proximity from failure and level of effort (4). The RIR-based RPE scale has specific RPE values corresponding to repetitions in reserve (RIR) or descriptors for level of effort (table 3). For example, an athlete may be prescribed 3 sets of 4 reps at an 8 RPE, rather than a specific % of 1RM.
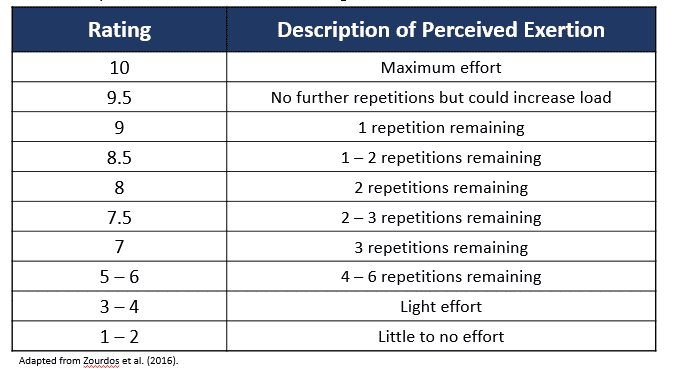 Table 3. Repetitions in Reserve-Based Rating of Perceived Exertion Scale
Although the RIR-based RPE scale is a level up from PBT in terms of individualizing load prescription, it still has some significant limitations. Firstly, RIR-based RPE accuracy improves as an athlete nears failure and when fewer reps are performed in a set (5). Logically, this phenomenon makes sense. I’m sure many of you have performed an easy set of 10 reps distant from failure and upon conclusion of the set said to yourself, “Well, I think that was somewhere around a 4 to 6 RPE, but I’m not really sure.” In contrary, I’m sure many of you have also performed a hard low-rep set close to failure and upon conclusion of the set said to yourself, “I’m confident that was a 9 RPE; that was definitely a 9 RPE.” Remember that despite the RIR-based RPE scale itself being objective, athletes provide subjective RPE scores or values on what they believe or perceive their RPE value to be. Secondly, individuals that are unaccustomed to using the RIR-based RPE scale are reasonably inaccurate at predicting the number of reps to failure (6). However, the ability to accurately predict the number of reps to momentary failure does improve with resistance training experience (6). Additionally, I would make the argument that highly experienced athletes that have been using the RIR-based RPE for quite some time and that use it frequently are most likely reasonably accurate at gauging their RPE scores. Conversely, some athletes may “undershoot” or “overshoot” their RPE values substantially. For example, let’s say that athlete 1 and athlete 2 performed a set to failure in the squat at the same % of 1RM and verbally indicated when they believed that they were at a 5, 6, 7, 8, 9, and 10 RPE.
Table 4 illustrates the actual RPE as well as the rated RPE and RPE difference for athlete 1 and athlete 2. In this particular example, athlete 1 tends to rate their RPEs higher than what the actual RPEs are; however, athlete 2 tends to rate their RPEs lower than what the actual RPEs are. To clarify, when athlete 2 is at an actual RPE of 8, they tend to believe that their RPE is 5, meaning that they perceive that they are 3 RPE values below what their actual RPE is.
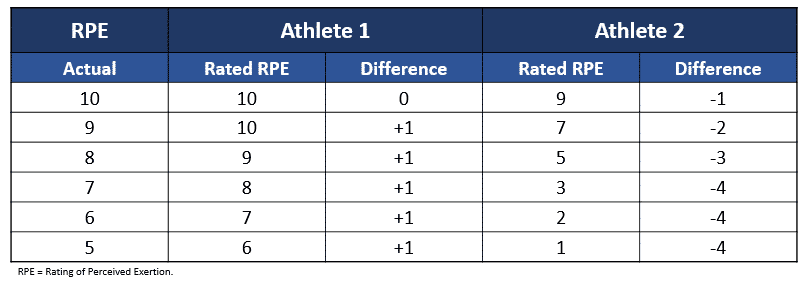 Table 4. Repetitions in Reserve-Based Rating of Perceived Exertion Scale for Athlete 1 and Athlete 2
Velocity-Based Load Prescription
In order to rectify the limitations of PBT and the subjectivity of RPE, VBT has been proposed as a solution to both of these previously aforementioned methods of load prescription (7). For example, an athlete may be prescribed 3 sets of 4 reps at 0.30 m.s-1, rather than a specified % of 1RM or specific RPE.
It is important to note that evidence has strongly supported the need for velocity to be individualized for both the lifter and the lift (8). However, the advantage of velocity is that it has also been well-supported that velocity is reliable at each percentage of 1RM (9) and at each RPE (10). Of course, all three methods of load prescription can be integrated together, as I’ve done in my Original Seminar; however, let’s take a step back for a moment. First, let’s integrate velocity with PBT to formulate a first rep velocity table. Next, let’s integrate velocity with RPE to formulate a last rep velocity table. Finally, let’s walk-through four examples of how to practically apply each table for individualized load prescription. Be cognizant that a first and last rep velocity table must be formulated for each athlete and for each lift, and that the velocity values at each % of 1RM and RPE are likely going to decrease over time as an athlete’s experience increases.

Formulating Individualized Velocity Tables
First Rep Velocity Table
A first rep velocity table integrates VBT with PBT; providing absolute velocity values for each % of 1RM. In order to formulate a first rep velocity table, an athlete performs a 1RM test and records the velocity of the first rep on every set. Upon completion of the 1RM test, the athlete determines the actual % of 1RM for each load lifted during the warm-up and inputs the corresponding velocity at each % of 1RM. Table 5 illustrates an example 1RM test; demonstrating the load and corresponding velocity of the first rep during each warm-up set.
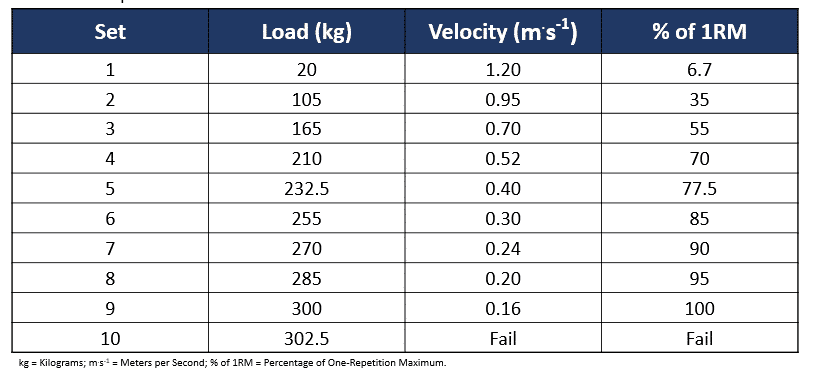 Table 5. Example 1RM Test
Next, the athlete can determine the velocity inputs by interpolating the remaining velocity values for each % of 1RM by analyzing the velocity from test (table 6). For example, the velocity at 92.5% of 1RM is the difference between the velocity at 95% of 1RM (0.20 m.s-1) and 90% of 1RM (0.24 m.s-1), which is 0.22 m.s-1. In this particular example, I’ve made the percentages of 1RM for each load lifted nice whole numbers for simplicity purposes; however, in a real setting these percentages of 1RM most likely won’t be perfectly evenly distributed. With that said, try to use loads that are ~ 70, 77.5, 85, 90, 95, and obviously you’ll use 100% of 1RM; thus, you have velocity values for the bottom end of the range (~ 70% of 1RM), the top end of the range (100% of 1RM), and the middle of the range (~85% of 1RM). Therefore, you can interpolate, rather than extrapolate, which will result in more reliable and valid data.
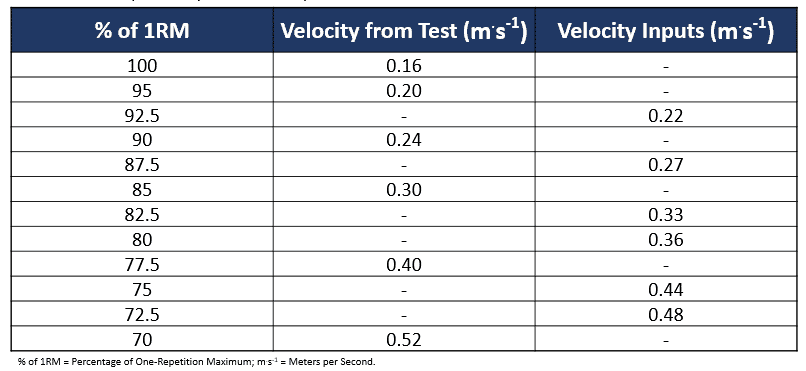 Table 6. First Rep Velocity Table Development
Once the velocities from the 1RM test and the velocities from the inputs have been determined, the first rep velocity table is complete (Table 7). Importantly, the more percentages of 1RM used during the 1RM test, the less velocity inputs must be determined; therefore, the more accurate the final velocity values of the first rep velocity table will be.
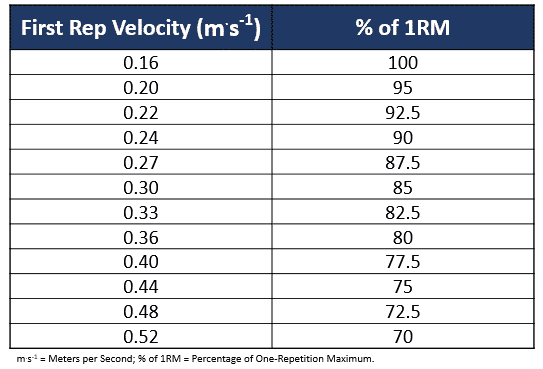 Table 7. First Rep Velocity Table
Last Rep Velocity Table
A last rep velocity table integrates VBT with RPE; providing absolute velocity values for each RPE. Formulating a last rep velocity table goes hand-in-hand with formulating a first rep velocity table. After completing the 1RM test, the athlete simply rests for ~ 8 minutes and then performs an as many repetitions as possible (AMRAP) test with a load in which they are confident that they can complete ~ 10 – 12 reps with. After completing the AMRAP test, the athlete can cross-reference and input the absolute velocity values for each RPE value. Table 8 illustrates an example AMRAP test; demonstrating the RPE and each corresponding velocity. Table 9 illustrates the velocities from the AMRAP test and the velocity inputs (interpolated velocities). Table 10 illustrates the completed last rep velocity table.
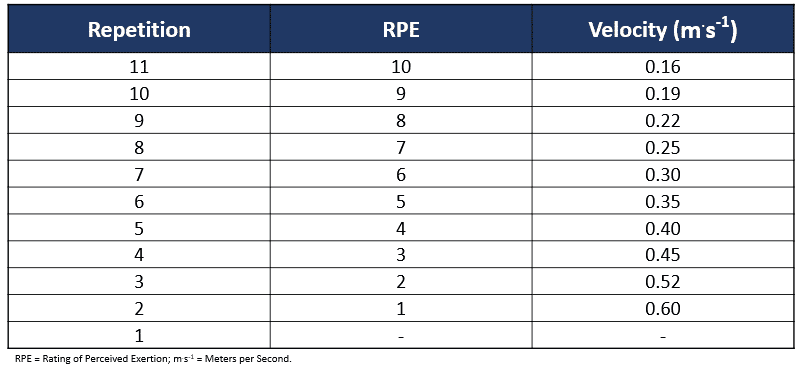 Table 8. Example AMRAP Test
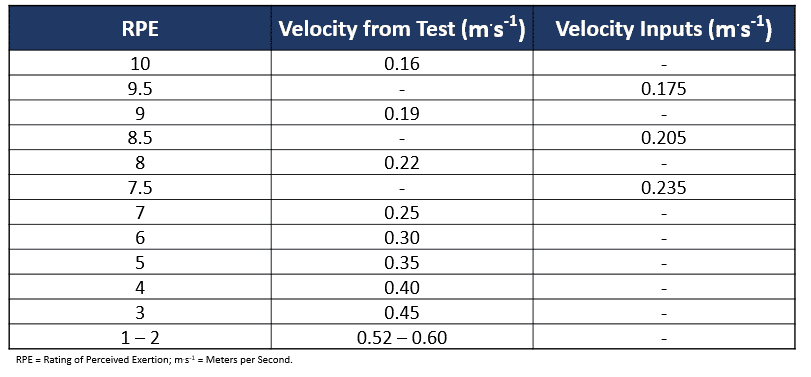 Table 9. Last Rep Velocity Table Development
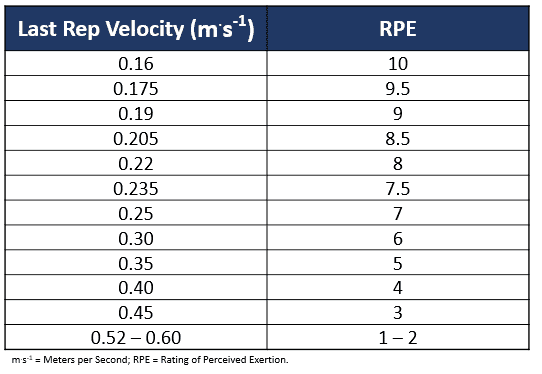 Table 10. Last Rep Velocity Table
Individualized Methods of Load Prescription
In this section, let’s use the first and last rep velocity tables that have been formulated in order to provide practical examples of four different individualized load prescription methods.
Method 1
The first method of load prescription involves using the first rep velocity table to prescribe a particular number of reps per set at a specific % of 1RM with load adjustments for the next set based on the actual 1RM of the previous set. For example, 3 sets of 4 reps at 85% of 1RM based on the first rep velocity may be prescribed (table 11). The first rep velocity is used to determine the actual % of 1RM for that particular set. From the actual % of 1RM, the actual 1RM is determined. The load used on the next set is 85% of 1RM from the previous set’s actual 1RM.
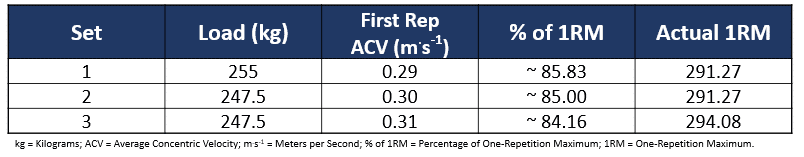 Table 11. 3 sets of 4 reps at 85% of 1RM (load adjustment based on actual 1RM)
In this example, 255 kilos is used on set 1, because 255 kilos is 85% of the pre-determined 1RM. A future article will address how to determine sessional 1RM; however, for simplicity and to simply demonstrate how to make load adjustments, I’ve just used the pre-determined 1RM. Nonetheless, a simple method to determine sessional 1RM is to track velocity during each warm-up set and use the first rep velocity table to approximate (or predict) sessional 1RM. On set 1, 4 reps are performed. After set 1 is completed, the first rep velocity is recorded. The first rep velocity on set 1 is 0.29 m.s-1, which – based on our first rep velocity table – means that 255 kilos is actually ~85.83% of 1RM for that particular set (set 1). Therefore, the actual 1RM for set 1 is 291.27 kilos (not 300 kilos). Therefore, on the next set (set 2), 85% of 1RM is still prescribed; however, it is 85% of 291.27 kilos. Therefore, the load used on the next set (set 2) is 247.5 kilos.
The advantage of this method is that it provides individualized load adjustments based on the actual 1RM of each set; thus, ensuring that the % of 1RM used on every set is accurate. However, the limitation of this method is that it does not account for the individual number of repetitions performed at each % of 1RM; thus, it does not account for proximity from failure (or RPE). For example, if we refer back to table 2, athlete 1 can only perform 6 reps at 85% of 1RM; therefore, they will be at ~ 8 RPE on every set. However, athlete 2 can perform 9 reps at 85% of 1RM; therefore, they will be at ~ 5 RPE on every set. In order to account for the same proximity from failure (or RPE) on every set, the second method of load prescription can be used.
Method 2
The second method of load prescription involves using the last rep velocity table to prescribe a particular number of reps at an RPE target with load adjustments for the next set based on the RPE of the previous set. For example, 3 sets of 4 reps at 8 RPE based on the last rep velocity may be prescribed (table 12). The last rep velocity is used to determine the actual RPE for that particular set. From the actual RPE, a load adjustment for the next set is made in attempt to ensure that the next set is at the desired or target RPE.
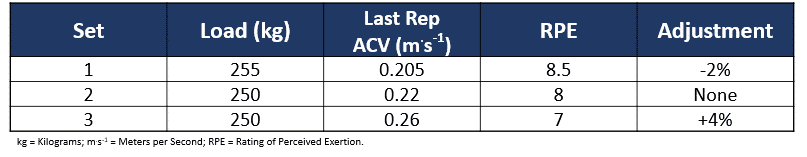 Table 12. 3 sets of 4 reps at 8 RPE (load adjustment based on actual RPE)
In this example, 255 kilos is used on set 1, because 255 kilos is 85% of the pre-determined 1RM. On set 1, 4 reps are performed. After set 1 is completed, the last rep velocity is recorded. The last rep velocity on set 1 is 0.205 m.s-1, which – based on our last rep velocity table – means that 255 kilos is actually an 8.5 RPE for that particular set (set 1). Therefore, since an 8.5 RPE is 0.5 RPE values above the target RPE of 8, the load is decreased by 2% on the next set (set 2). Therefore, on the next set (set 2), 250 kilos is used (not 255 kilos). Table 13 illustrates the load adjustments based on the study from Helms and colleagues that can be used based on the number of RPE points above or below the target RPE in attempt to provide the target RPE on the next set (11).
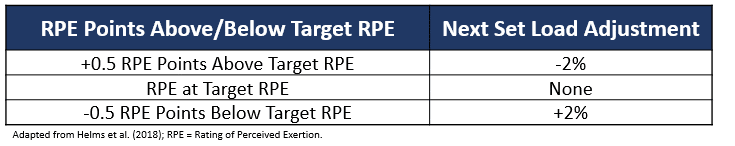 Table 13. Load Adjustments based on RPE
Method 3
The third method of load prescription involves prescribing a certain total number of reps to complete within the session and stipulating that each set terminate at a particular RPE. For example, 15 total reps for the session at 85% of 1RM while stopping each set at an 8 RPE based on the last rep velocity may be prescribed, regardless of the number of reps performed per set (table 14). In this particular example, after set 3, a total of 13 reps were completed. Therefore, on set 4, only 2 repetitions were required to be performed in order to meet the 15 total reps for the session; thus, set 4 was terminated at 2 reps despite only being at a 7 RPE.
You’ve probably recognized that this method of load prescription involves integrating a method of volume autoregulation within the set; however, the total sessional volume (via total number of reps) remains constant. I will be addressing how to autoregulate sessional volume in a future article.
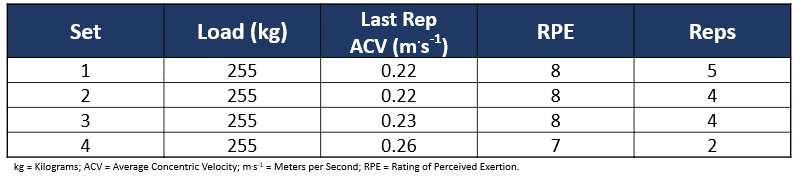 Table 14. 15 Total Reps at 85% of 1RM (Stop each Set at 8 RPE)
Method 4
The fourth method of load prescription involves prescribing a certain total number of sets to be completed within the session and stipulating that each set terminate at a particular RPE. For example, 4 total sets for the session at 85% of 1RM while stopping each set at an 8 RPE based on the last rep velocity may be prescribed, regardless of the number of reps performed per set (table 15). In this particular example, why was set 4 terminated at an 8.5 RPE, and not earlier at an 8 RPE? Rep 2 must have been at less than an 8 RPE; thus, another rep (rep 3) was performed. However, since rep 3 was at an 8.5 RPE; thus, reaching or exceeding the RPE stop of 8, the set was terminated.
A progression model may also be integrated into this load prescription method. In this particular example with an 8 RPE stop, the athlete was able to complete 4 reps on set 1; however, the athlete was only able to complete 3 reps on sets 2, 3, and 4. An example progression is to progress to the next incremental load only when the athlete can perform 4 reps on all 4 sets at the 8 RPE stop. I will be addressing how to implement progression models in a future article.
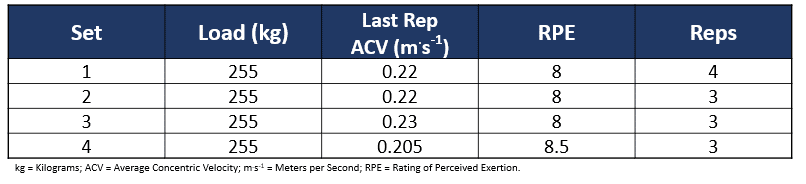 Table 15. 4 Total Sets at 85% of 1RM (Stop each Set at 8 RPE)
Conclusion
This article explained how to formulate what I term first rep velocity tables by integrating VBT with PBT, in addition to last rep velocity tables by integrating VBT with RPE. Additionally, it provided step-by-step instruction on how to apply four different load prescription methods. The first involved using the first rep velocity table to prescribe a particular % of 1RM and make individualized load adjustments based on the actual predicted 1RM of each set. The second involved using the last rep velocity table to prescribe a particular number of reps at a target RPE and make load adjustments based on the actual RPE of each set. The latter two methods involved autoregulating the number of reps in the set with RPE stops, while maintaining the sessional volume for either the total number of reps or total number of sets in the session constant. Finally – I know I’ve stated this countless times – but remember that although I represented these four load prescription methods as mutually exclusive for simplicity purposes, we can integrate all of these methods, and there are endless methods of load prescription that can be applied that I did not address in this article. As a quick reference guide, a summary of all four load prescription methods addressed in this article is illustrated in table 16.
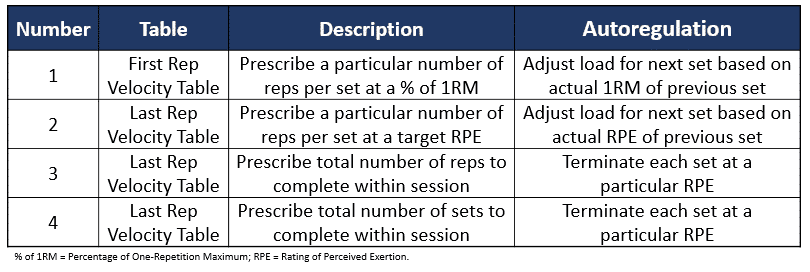 Table 16. Summary of 4 Load Prescription Methods
Key Takeaways
First rep velocity tables ensure that the correct percentage of 1RM is used on every set, and last rep velocity tables ensure that the target or stopping RPE is accurate
- These four methods of load prescription were presented as separate methods; however, all of them can and should be integrated and remember that there are endless other methods to prescribe load
- Load prescription methods may be combined with within-set volume autoregulation strategies, as well as with sessional autoregulation strategies and progression models
If you are looking to reach your fullest potencial as an athlete and you want to learn more about sport science, VBT training and how to improve your workout routine, we have lots of articles that can help you achieve your goal. If you have any questions, don’t hesitate to ask! Leave a comment or contact us here.
References
- Baechle, TR, and Earle, RW. Essentials of Strength Training and Conditioning. Champaign, IL: Human Kinetics, 2008.
- Zourdos, MC, Dolan, C, Quiles, JM, Klemp, A, Jo, E, Loenneke, JP, Blanco, R, and Whitehurst, M. Efficacy of daily one-repetition maximum training in well-trained powerlifters and weightlifters: a case series. Nutricion Hospitalaria 33(2): 437 – 443, 2016.
- Rodriguez-Rosell, D, Yanez-Garcia, JM, Sanchez-Medina, L, Mora-Custodio, R, and Gonzalez-Badillo, JJ. Relationship between velocity loss and repetitions in reserve in the bench press and back squat exercises. The Journal of Strength and Conditioning Research [Epub ahead of print], 2019.
- Zourdos, MC, Klemp, A, Dolan, C, Quiles, JM, Schau, KA, Jo, E, Helms, E, Esgro, B, Duncan, S, Garcia Merino, S, and Blanco, R. Novel resistance training-specific rating of perceived exertion scale measuring repetitions in reserve. The Journal of Strength and Conditioning Research 30(1), 267 – 275, 2016.
- Zourdos, MC, Goldsmith, JA, Helms, ER, Trepeck, C, Halle, JL, Mendez, KM, Cooke, DM, Haischer, MH, Sousa, CA, Klemp, A, and Byrnes, RK. Proximity to failure and total repetitions performed in a set influences accuracy of intraset repetitions in reserve-based rating of perceived exertion. The Journal of Strength and Conditioning Research [Epub ahead of print], 2019.
- Steele, J, Endres, A, Fisher, J, Gentil, P, and Giessing, J. Ability to predict repetitions to momentary failure is not perfectly accurate, though improves with resistance training experience. PeerJ 5: e4105, 2017.
- Pareja-Blanco, F, Rodriguez-Rosell, D, Sanchez-Medina, L, Sanchis-Moysi, J, Dorado, C, Mora-Custodio, R, Yanez-Garcia, JM, Morales-Alamo, D, Perez-Suarez, I, Calbet, JAL, and Gonzalez-Badillo, JJ. Effects of velocity loss during resistance training on athletic performance, strength gains and muscle adaptations. Scandinavian Journal of Medicine & Science in Sports 27(7), 724 – 735.
- Helms, ER, Storey, A, Cross, MR, Brown, SR, Lenetsky, S, Ramsay, H, Dillen, C, and Zourdos, MC. RPE and velocity relationships for the back squat, bench press, and deadlift in powerlifters. The Journal of Strength and Conditioning Research 31(2): 292 – 297, 2017.
- Banyard, HG, Nosaka, K, Vernon, AD, and Haff, GG. The reliability of individualized load-velocity profiles. International Journal of Sports Physiology and Performance 13(6): 763 – 769, 2018.
- Moran-Navarro, R, Martinez-Cava, A, Sanchez-Medina, L, Mora-Rodriguez, R, Gonzalez-Badillo, JJ, and Pallares, JG. Movement velocity as a measure of level of effort during resistance exercise. The Journal of Strength and Conditioning Research 33(6): 1496 – 1504, 2019.
- Helms, ER, Byrnes, RK, Cooke, DM, Haischer, MH, Carzoli, JP, Johnson, TK, Cross, MR, Cronin, JB, Storey, AG, and Zourdos, MC. RPE vs percentage 1RM loading in periodized programs matched for sets and repetitions. Frontiers in Physiology 9: 247, 2018.