
One of the most exciting and comforting moments of every coach on earth is when our athletes nailed a PR. It´s almost as if we ourselves were accomplishing it and the feeling of “my job is paying off” is the perfect meal to feed our ego.
But, what if I told you that there is a chance that you may have been misinterpreting your athlete’s TRUE progress?
A couple of years ago, during a statistics coursework for my master’s degree, we were talking about how to interpret test results and analyzing different data sets. One of the exercises consisted of analyzing the difference between some pre and post-tests, interpreted them, presenting a report and sharing it with the rest of the class. It looked like a pretty simple and easy task, in fact too easy. I completed the assignment using a simple analysis showing the individual % of change and comparing it with the group mean. So far so good.
However, the simple task was nothing but a professor´s trap. As soon as he reviewed one of the reports he said one of the most powerful quotes I´ve ever heard and the one that changed the way I felt about stats going from pure hate to start looking at it with much more enthusiasm. “anyone can be a great coach with a shitty use of statistics”.
Long story short, the task was simply an introduction to one of the most, if not the most, relevant statistical topics in the sports science field, magnitude-based inference analysis (MBI)1,2.
Let’s consider the results obtained from a measurement. If we could make a ‘perfect’ measurement, we would obtain the ‘true value’. However, the reality is, that the measurements that we make are never perfect, and the values obtained from measurement are therefore estimations of this ‘true value’. A measured value will differ from the hypothetical ‘true value’ for a number of different reasons, some of which we may know about, some we may not.
Figure 1: Accuracy and reproducibility (precision) of a measurement. The true value is always unknown but the closer the measurements mean get to it, the higher is the measurement accuracy3.
We call the difference between a measured value and the ‘true value’ of the ERROR, and the closer is one to another the more accurate our measurement is. By definition, we can never know the exact ‘true value’ and without it, we can´t also know the exact difference between it and the measurements we made. So knowing the exact value of an error is impossible as well3.
However, we can describe the error in the result of a particular measurement as a draw from a probability distribution. The uncertainty associated with a measured value is a measure of that probability distribution. In particular, the standard uncertainty is the standard deviation of this probability distribution. This means that the more variability of a data set the more uncertainty and error we will have.
Everyone is familiar with 1RM testing, which is often considered as the ‘gold standard’ for assessing the strength capacity of individuals in non-laboratory environments4
Performing a 1RM test protocol is probably going to give us greater accuracy but on the other hand, it´s time-consuming, fatiguing and affected by internal (for example, circadian rhythms have been shown to significantly alter performance 5,) and external factors such as verbal feedback from the coach 6 or even music7. Also, we cannot perform the test on a daily basis so maybe we are not detecting improvements or decrements because of the temporal framework in which the test is applied. Therefore we are missing the chance to adjust the plan on time.
Contrarily, when estimating the 1RM value and if we choose the appropriate method, we are gaining practicality, simplicity, time and viability for shorter periods of time (daily, weekly) without negatively affecting the normal training process, but in the expense of a greater “uncertainty” and “error”, even though we could really, I mean really, reduce it.
So, if we hypothetically test (or estimate) 1RM the same day with the same athlete with no negative effect of one test with the others, we are going to obtain 3 different values, a mean and a given variability (SD). So, the question is how can we be certain that the difference is “real” (signal) improvements and not the normal variation of the data (Noise).
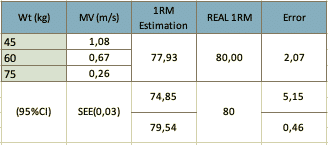
Figure 2: Example of an estimation of 1RM with 3 submaximal loads and the comparison with an actual 1RM Test. Note that the estimation is 2,07 kg less than the actual 1RM and with a CI of 95% the difference varies between 5,15 and 0,46kg. Not taking this into account could generate misleading interpretations and decisions.
Estimating 1 RM using VBT
Testing days are a bit left behind us, excluding the strength sports (but even there). Coaches nowadays cannot afford to dedicate a whole day for testing, especially in team sports which compete every weekend. But the essence of testing is monitoring both training loads and training effects without negatively affecting the normal training process, helping us to modify the training process if we need to8.
In the past, even though velocity-based training (VBT) existed, it was only used for research mainly because of the costs of the devices. But, in the last decade, the rapid spread and increasing affordability of linear transducers contribute to nowadays reality where pretty much every up-to-date strength coach incorporates VBT in their programs.
Using VBT has been proved to be a really precise way to estimate 1RM because of the linear and stable mathematical relationship (inversely correlated, with correlation coefficients of > 0.95) that exists between load and the average concentric velocity at which that load is moved9,10 at least as good as the repetition-to-failure method 10. Moreover, the two-point method has recently emerged as a valid, feasible, quick and fatigue-free procedure for the assessment of both the force-velocity and load-velocity relationships, which only need to perform 2 different external loads representing approximately 50 and 80% of self-reported 1RM to get a L-V Profile11–13.
Figure 3: Example of L-V profile in Bench Press performed by a Youth Rugby Player (Measured via Vitruve Device).
Figure 4: Two-Point Method for the assessment of the L-V Profile García Ramos, Amador & Jaric, Slobodan, (2017) 11.
However, a couple of things needs to be considered:
- Traditional exercises such as squat, bench press, deadlift, etc. have their own Load-Velocity (L-V). This means we need to establish the L-V profile for a given athlete and exercise before estimating it with submaximal loads on a daily basis 9.
- L-V Relationship is more sensitive to Mean velocity or mean propulsive velocity than peak velocity in traditional exercises 10.
- The device must be valid and reliable 14.
- Maximal load attempts are associated with a specific velocity that is known as the “minimal velocity threshold (MVT)” 15. This means that the mean velocity of the 1RM will not be significantly different, from a statistics point of view, from the mean velocity of the last repetition of a given RM (5RM, 3RM, etc). There is plenty of research about different exercises and their MVT´s (For example bench press and squat usually are around 0,13 – 0,3 m/s respectively)16,17
- Greater relative %RM are stronger predictors of the actual 1RM than lower ones 11. 5RM load is less precise than 3RM load to estimate 1RM.
Figure 5: Example of linear behavior and MVT achieved for a given number of reps to failure performed with 70% and 85% 1RM (Measured via Vitruve Device).
So, once we know the L-V profile for a given athlete and a given exercise as well as the MVT, we are ready to go!
Magnitude-Based Inference
MBI is based on the work of Professors William Hopkins and Alan Batterham 18 and tries to address some shortcomings that the use of traditional statistical approaches may generate, helping to identify differences and optimizing the decision-making process.
Sports scientists and coaches usually deal with small groups of athletes to collect and analyze data such as in field sports environments, and even with N=1, such as in powerlifting, track and field and also in field sports where analyzing individual changes over time become crucial. Moreover, sometimes small changes are just worth it even though the differences are no relevant from a statistical point of view (how many milliseconds separate winner from losers in a 100mts sprint Olympic final, or cm in a shotput or kg in a powerlifting or weightlifting contests). Traditional stats go well neither with small N nor with tiny differences to give insightful information.
One of the cornerstones of MBI is the definition of the smallest practically meaningful change, or the Smallest Worthwhile Change (SWC). But first is crucial to understand what change really is.
Change relates very intimately to the concept of difference i.e. change is judged based on a difference in some measurable entity and almost always it relates to a time span3. For example, if due to training, an athlete increases his 1RM from 110 to 150 in 6 weeks, this will be considered, a positive change. The basic tenet is that measurements of the same variable differ from one test session to the other when spanned over days or weeks. However, as we already review, we are dealing with a lot of uncertainty especially when differences are not that big.
Figure 6: Black point represents the mean of a given test; the lines CI (error); Vertical line is the group mean and grey area is the SWC19
So, getting back to SWC, taking it together with the typical error of a test (TE) can help us out in determining if the change of a given variable is real (signal) or just part of the normal variability (distribution) of the measurement (noise).
We must take into account 3 points when calculating SWC for an individual:
- Perception, based on experience can be used for SWC. For example, in the IMTP test changes of less than 5N are just probably noise.
- Measurement error is crucial to identify Signal and Noise. For example; if the TE is 5N for the IMTP, SWC cannot be less than twice that value otherwise uncertainty is too big to differentiate between real changes and variability.
- If we test a group of athletes, we can multiply 0,2 times athletes SD to get SWC and 0,3 if the data set is taken from one individual multiple tests.
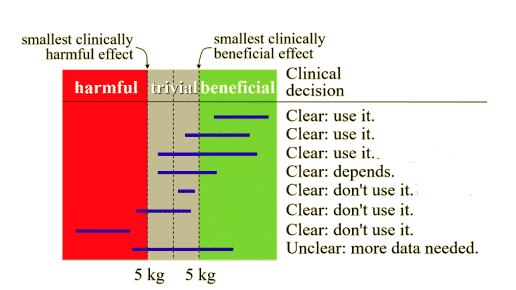
Figure 7: Decisions in Magnitude-Based Inference are made based on confidence intervals or distribution (blue horizontal lines) in relation to an SWC (dashed vertical lines on each side of the trivial area). For example; Any increase or decrease on an athlete 1RM larger than 5 kg is considered relevant, while all changes smaller than 5 kg are too small to be of practical relevance (i.e., trivial). As the confidence interval (distribution) moves further from the trivial zone (either to a beneficial or harmful area) the likelihood of a true effect increases20.
Practical Applications
We now have a way of estimating our athletes 1RM that can be implemented even in the warm-up sets. Using sub max weights and tracking concentric velocity we can create a method where we can track our 1RM on a daily basis without fatiguing, wasting time and affecting the training session. Mixing it up with MBI can be a powerful model capable of giving us valuable information about the likelihood of improving or decreasing our 1RM without even testing it.
The following image is from a spreadsheet taken from Mladen Jovanovic. Pretty much this entire blog post is inspired in his work. I strongly recommend everyone to follow his work because it’s probably (not MBI calculated) one of the most disruptive, groundbreaking and useful in the field.
Figure 8: Daily 1RM tracking using VBT from 1 Set of a fixed weight using the fastest Rep mixed with MBI to estimate the likelihood of change during 1 year. Blue dots represent Data Point with Error Bars; Grey Line is the Baseline and Grey area Represents SWC. Green Line represents the likelihood of a harmful effect express as %. Green Arrows represents moments when the chances of true benefits are high and red arrows moments when chances of true harm are greatest.
Using this approach may help in both assessing the effect of different training aspects such as Volume, frequency, density and load on the “outcome” (1RM) and also be used as a readiness tool.

Bibliography
- Hopkins, W. G. Magnitude Matters. Medicine & Science in Sports & Exercise 38, 56 (2006).
- Batterham, A. M. & Hopkins, W. G. The Case for Magnitude-based Inference. Medicine & Science in Sports & Exercise 47, 885 (2015).
- Dvir, Z. Difference, significant difference and clinically meaningful difference: The meaning of change in rehabilitation. J Exerc Rehabil 11, 67–73 (2015).
- Levinger, I. et al. The reliability of the 1RM strength test for untrained middle-aged individuals. Journal of Science and Medicine in Sport 12, 310–316 (2009).
- WINGET, C. M., DEROSHIA, C. W. & HOLLEY, D. C. Circadian rhythms and athletic performance. Medicine & Science in Sports & Exercise 17, 498???516 (1985).
- Argus, C. K., Gill, N. D., Keogh, J. W. & Hopkins, W. G. Acute Effects of Verbal Feedback on Upper-Body Performance in Elite Athletes. Journal of Strength and Conditioning Research 25, 3282–3287 (2011).
- Loizou, G. & Karageorghis, C. I. Effects of psychological priming, video, and music on anaerobic exercise performance. Scand J Med Sci Sports 25, 909–920 (2014).
- Clarke, D. C. & Skiba, P. F. Rationale and resources for teaching the mathematical modeling of athletic training and performance. Advances in Physiology Education 37, 134–152 (2013).
- González-Badillo, J. J. & Sánchez-Medina, L. Movement Velocity as a Measure of Loading Intensity in Resistance Training. Int J Sports Med 31, 347–352 (2010).
- Jidovtseff, B., Harris, N. K., Crielaard, J.-M. & Cronin, J. B. Using the load-velocity relationship for 1RM prediction. Journal of Strength and Conditioning Research 25, 267–270 (2011).
- Garcia-Ramos, A. & Jaric, S. Two-Point Method. Strength and Conditioning Journal 40, 54–66 (2018).
- García-Ramos, A. et al. Feasibility of the 2-Point Method for Determining the 1-Repetition Maximum in the Bench Press Exercise. International Journal of Sports Physiology and Performance 13, 474–481 (2018).
- Snyder, B. W., Zangakis, D. S., Moir, G. L., Munford, S. N. & Davis, S. E. Validity of the Two-Point Method for Estimating Squat and Bench Press One Repetition Maximums. Medicine & Science in Sports & Exercise 51, 49 (2019).
- Pérez-Castilla, A., Piepoli, A., Delgado-García, G., Garrido-Blanca, G. & García-Ramos, A. Reliability and Concurrent Validity of Seven Commercially Available Devices for the Assessment of Movement Velocity at Different Intensities During the Bench Press. Journal of Strength and Conditioning Research 33, 1258–1265 (2019).
- Izquierdo, M. et al. Effect of Loading on Unintentional Lifting Velocity Declines During Single Sets of Repetitions to Failure During Upper and Lower Extremity Muscle Actions. Int J Sports Med 27, 718–724 (2006).
- Ayllon, F., Larumbe, E., Jiménez, A. & Alvar, B. 1 Rm Prediction From The Linear Velocity And The Rate Of Perceived Exertion In Bench Press And Paralell Squat. Journal of Strength and Conditioning Research 24, 1 (2010).
- Banyard, H. G., Nosaka, K. & Haff, G. G. Reliability and Validity of the Load–Velocity Relationship to Predict the 1RM Back Squat. Journal of Strength and Conditioning Research 31, 1897–1904 (2017).
- Batterham, A. M. & Hopkins, W. G. Making Meaningful Inferences About Magnitudes. International Journal of Sports Physiology and Performance 1, 50–57 (2006).
- Jovanovic, M. Statistical Modelling for Sports Scientists: Practical Introduction Using R (Part 1). (2019). doi:10.31236/osf.io/dnq3m
- Hooren, B. Magnitude-based inference: What is it? How does it work and is it appropriate? (2018).


Nice post !!!!